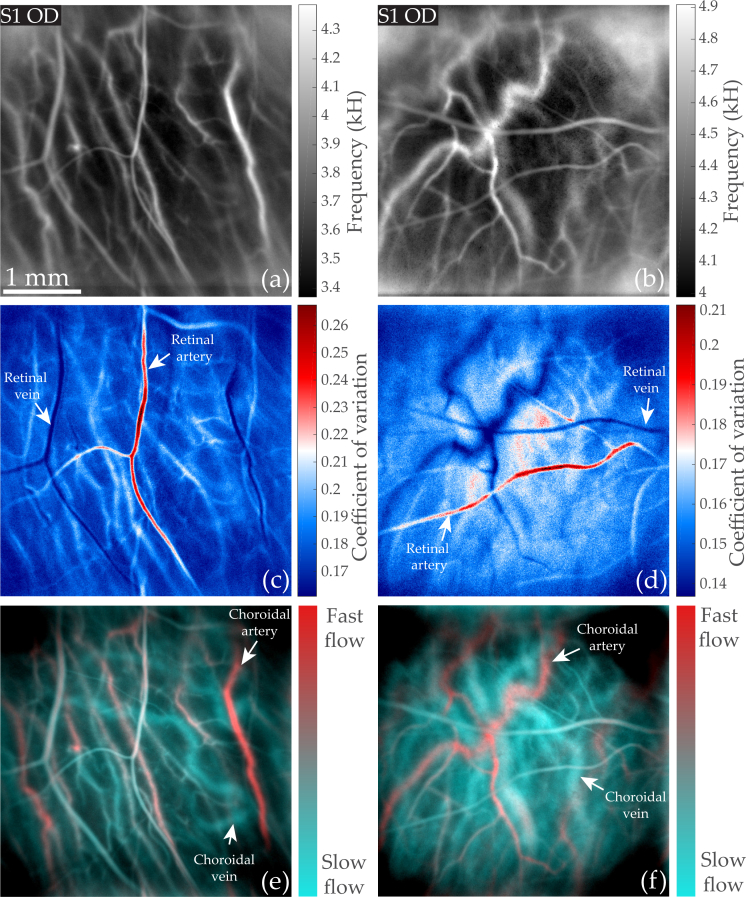
Fig. 9.
Arteriovenous differentiation in the retina and choroid. (a) and (b): mean Doppler frequency fmean(x, y). (c) and (d): coefficient of variation CVM0 revealing retinal arteries and veins. (e) and (f): color composite images obtained by merging low frequency and high (2.5–6 kHz, 10–30 kHz) power Doppler images in cyan and red, allowing identification of choroidal arteries and veins (colorbars are only indicative).

