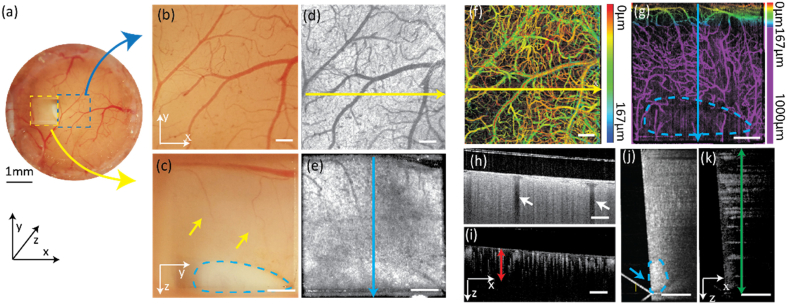
Fig. 3.
(a) Optical microscopic image of the entire cranial window with both top-view (blue dash square) and side-view (yellow dash square) from the prism; (b) Magnified optical microscopic image of the area corresponding to the blue dashed area in panel a; (c) Magnified optical microscopic image of the area corresponding to the yellow dashed area in panel a. Yellow arrows: vessels in the deep cortex area; blue dash area: white matter. (d) Top-view en face vis-OCT image; (e) Side-view en face vis-OCT image; (f) Top-view vis-OCTA image with color-coded vessel depths; (g) Side-view en face vis-OCTA image with color-coded vessel depth. Purple area: deep cortex imaged through the prism. Blue dashed area: white matter; (h, i) vis-OCT & vis-OCTA B-scan images acquired from the top-view. White arrows: vessel shadows from top block signal beneath them; Red arrow: effective image depth around 250 µm calculated from the vis-OCTA vessel signal; (j, k) Vis-OCT & Vis-OCTA B-scan images acquired from the side view. green arrow: 1 mm image depth through the prism; blue arrow and dash area: higher backscattering intensity from white matter. (White scale bar: 200 µm).

