Fig. 5.
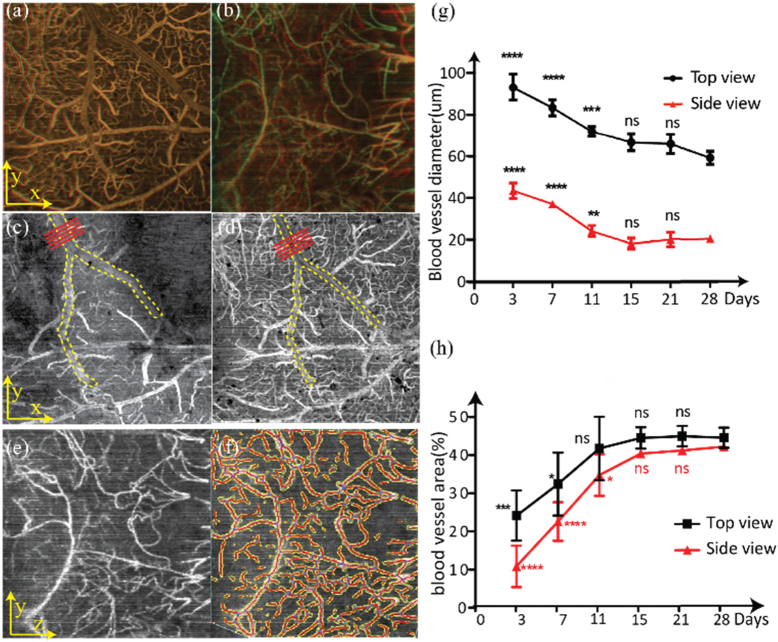
Determining blood vessel stability using vessel morphology, diameter, and density. (a) Overlaid top-view vis-OCTA en face images from day 15 and day 28; (b) Overlaid side-view vis-OCT en face images from day 15 and day 28. Yellow color: overlapped regions. (c) Top-view vis-OCT image from day 3; (d) Top-view vis-OCT image from day 15. The yellow dashed lines highlight the main vessel within the field of view. The red lines highlight where vessel diameters were measured; (e) Side-view vis-OCTA image on day 11; (f) Vessel segmentation using AngioTool. Yellow: boundaries of automatically detected vessels. Red: centerlines of vessels; (g) Changes in vessel diameters from day 3 to day 28 from both top-view and side-view vis-OCTA images. Mean and standard deviations are plotted. (h) Changes in vessel area density from day 3 to day 28 from both top-view and side-view vis-OCTA images. Mean and standard deviations are plotted. Statistical analysis is compared with Day 28. ns: no significant difference. *: P < 0.05, **: P < 0.01, ***: P < 0.001, ****: P < 0.0001.

