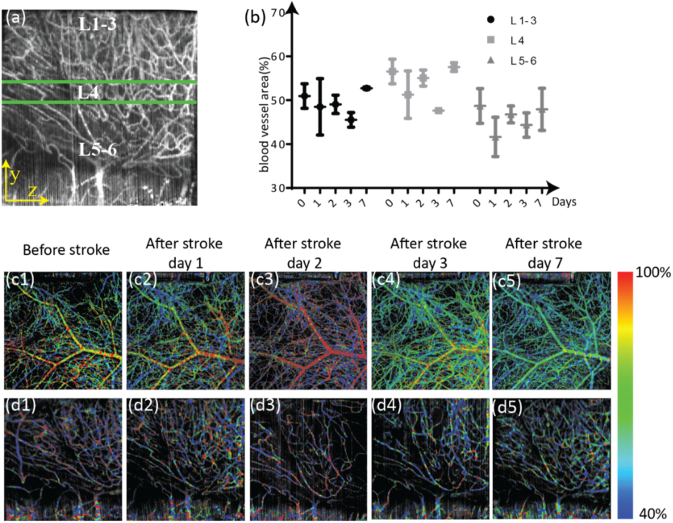
Fig. 7.
Vascular changes during the first week after stroke. (a) Side-view vis-OCTA en face image showing the cortical layer separations, with the three layer groups highlighted by the green horizontal lines. L1-3: layers 1-3 of the cortex; L4: layer 4 of the cortex; L5-6: layers 5 and 6 of the cortex. (b) Changes in vessel density from day 0 (acquired immediately before performing the stroke) to day 7 after the stroke, separated by cortical layer groups. Mean and standard deviation across three mice are plotted. (c1-c5) Top-view vis-OCTA en face images pseudo-colored according to measured sO2, from immediately before stroke to 7 days after stroke. (d1-d5) Side-view vis-OCTA en face images pseudo-colored according to measured sO2, from immediately before stroke to 7 days after stroke.

