Fig. 1.

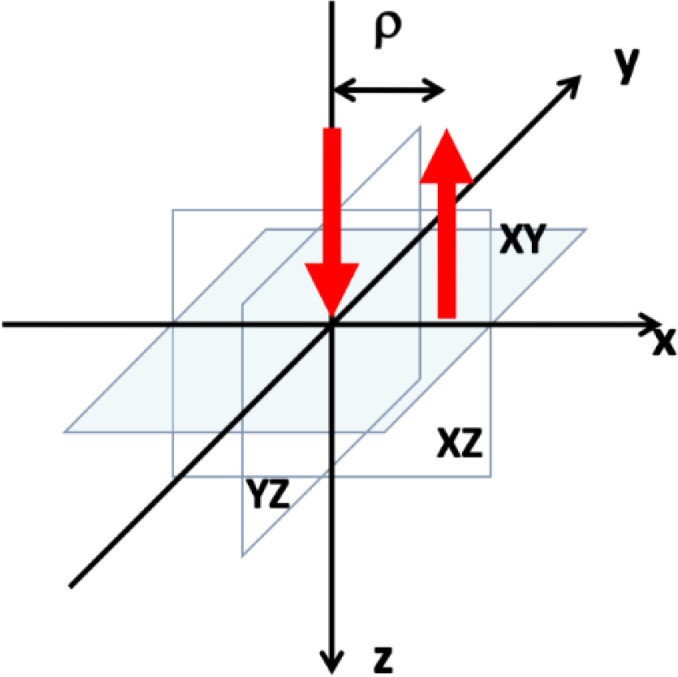
Geometry used for sensitivity distributions simulations. Red arrows mark positions of source and detector located at interoptode distance on the surface of the medium (plane XZ).

Geometry used for sensitivity distributions simulations. Red arrows mark positions of source and detector located at interoptode distance on the surface of the medium (plane XZ).