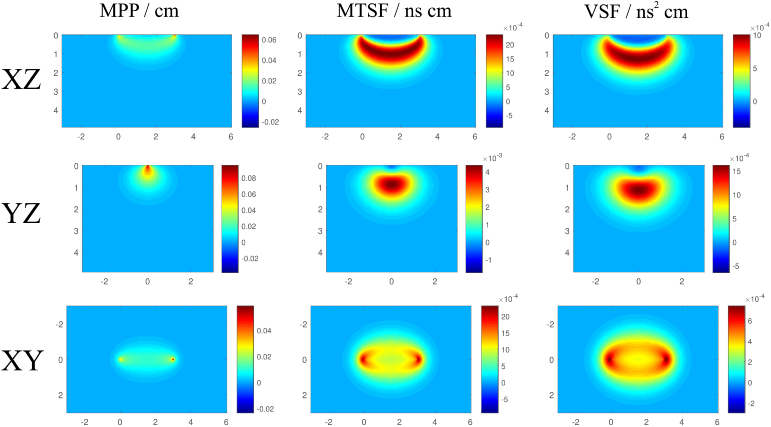
Fig. 2.
Spatial distributions of sensitivity factors (for attenuation – MPP, for mean time of flight – MTSF and for variance of the DTOF – VSF) obtained for source-detector separation of ρ=3cm i.e. for the source located at x = 0, y = 0,z = 0 and the detection spot located at x = 3cm, y = 0, z = 0 (geometry presented in Fig. 1).

