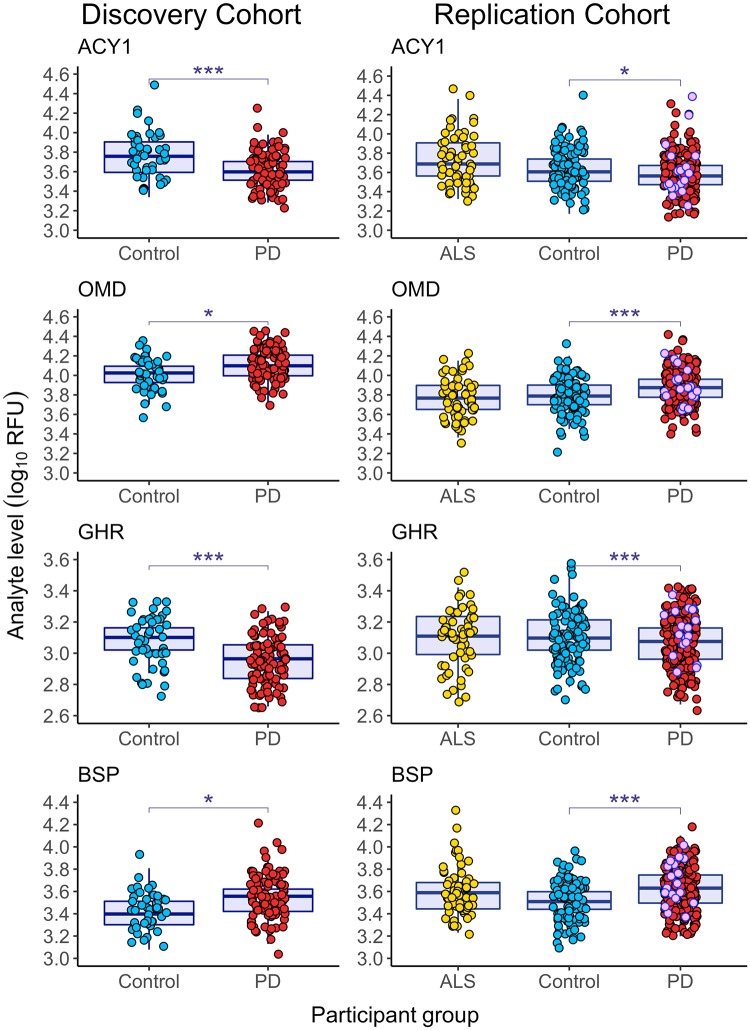
Fig 3. Blood-based biomarkers found in both Discovery and Replication Cohorts.
Boxplots (median and IQR) showing the distribution of the top four biomarker protein levels (log10 of RFU) found in both the Discovery and Replication Cohorts according to diagnosis. The y-axis represents plasma protein levels (log10 of RFU), and the x-axis displays the diagnostic group, with each dot representing one research participant. In the Replication Cohort, 18 PD participants had never been treated with dopaminergic medication (pink dots). Biomarker measures for these never-treated PD participants did not differ from biomarker measures for PD participants treated with dopaminergic medication (Wilcoxon test nominal p > 0.05). FDR-adjusted (Benjamini-Hochberg method) *p < 0.05, ***p < 0.005. ACY1, aminoacylase-1; ALS, amyotrophic lateral sclerosis; BSP, bone sialoprotein; FDR, false discovery rate; GHR, growth hormone receptor; OMD, osteomodulin; PD, Parkinson’s disease; NC, neurologically normal control; RFU, relative fluorescence unit.

