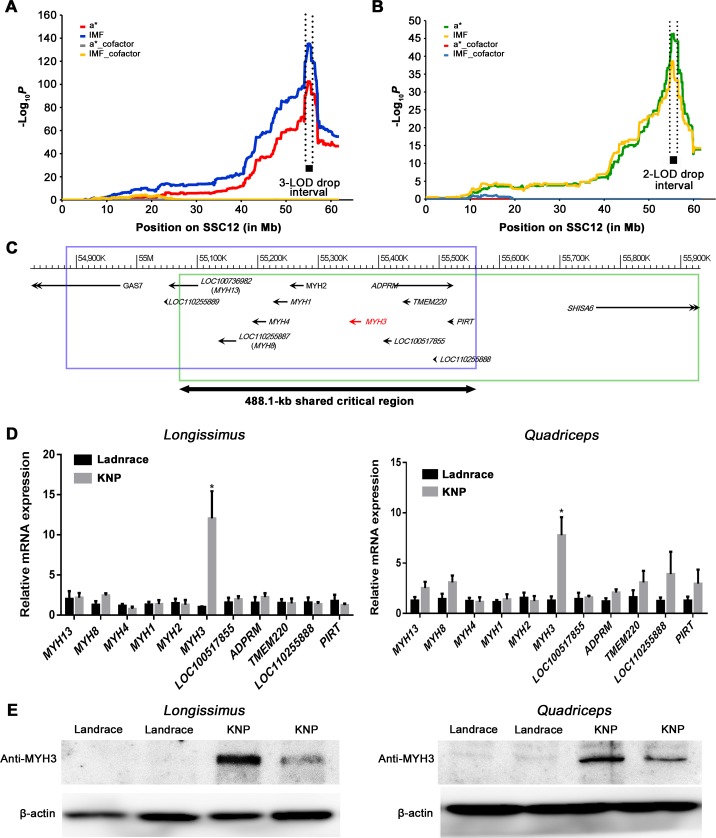
Fig 2. High-resolution mapping of a QTL that affects a* and IMF contents in the longissimus dorsi muscles of LK (n = 1,232) and DK (n = 395) crosses.
(A) LALD mapping results on SSC12 for a* and IMF from the LK cross. In the case of a* and IMF, the LALD mapping with correction for the effect of the most likely QTL did not show any sign of additional QTL on SSC12 (yellow and gray dotted lines). (B) LALD mapping results on SSC12 for a* and IMF from the DK cross. The vertical dotted lines for each cross were estimated by the LOD-drop method (S3 Fig). (C) Blue (LK cross, 3-LOD drop support interval) and green (DK cross, 2-LOD drop support interval) boxes indicate cross-specific LOD-drop support intervals. Maximum test statistics for each cross were obtained at the region colocalized in the 488.1-kb critical shared region represented by the black double headed arrow (12: 55,073,130–55,561,243). Eleven NCBI protein coding genes are located within the 488.1-kb critical interval associated with a* and IMF. Gene names in parentheses were annotated by this study (S1 Table and S4 Fig). (D) Gene transcription analysis of the 11 positional candidate genes. Relative mRNA expression levels of the 11 genes in the longissimus dorsi muscle (left) and in the quadriceps muscle (right) in Landrace (n = 6) and KNP (n = 6). Data histograms and error bars represent the mean±standard error, *P<0.05. (E) Western blotting analysis of MYH3 in the longissimus dorsi muscle (left) and in the quadriceps muscle (right) between Landrace and KNP. We used a muscle sample from one animal per lane.

