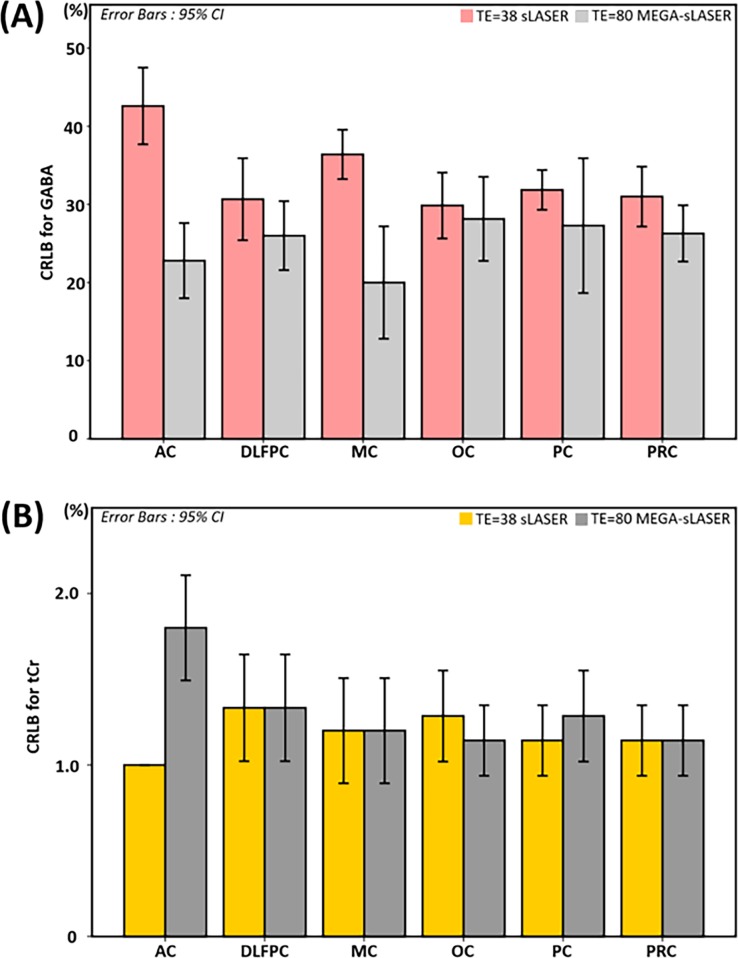
Fig 5. Cramér–Rao lower bound (CRLB) comparison.
This figure compares CRLBs of (a) GABA and (b) total Cr (tCr) between semi-LASER (sLASER) and MEGA-sLASER for the six brain regions examined. Error bars indicate 95% confidence intervals, in accordance with Table 1.

