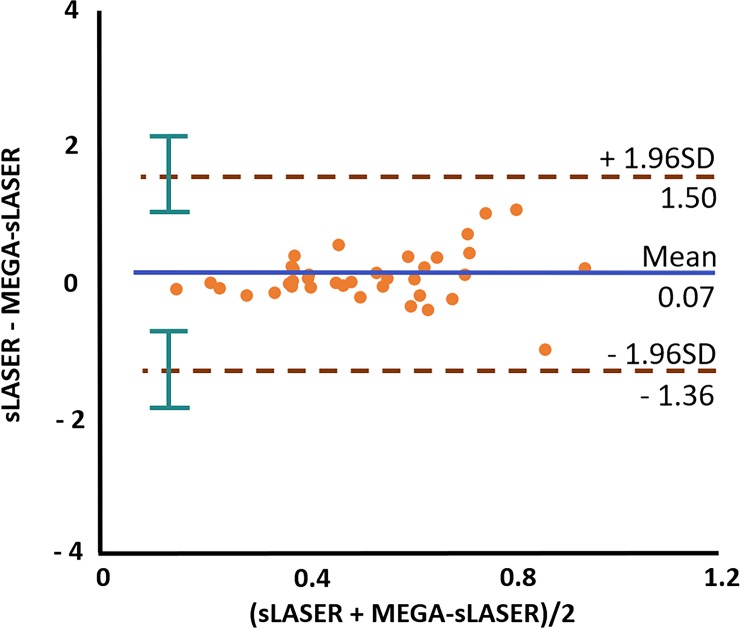
Fig 6. Bland-Altman plot for GABA.
Bland-Altman plot of the GABA concentration from the interleaved measurements using the semi-LASER (sLASER) and MEGA-sLASER approaches afterthe LCModel analysis. The blue horizontal line shows a mean value and two brown lines show ± 1.96 * SD with 95% confidence intervals (green) across all measurements.

