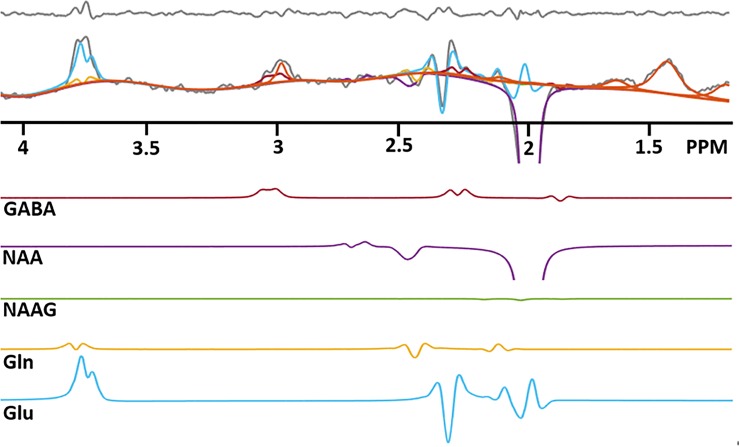
Fig 7. One example of GABA edited spectrum (gray) with metabolite fitting lines.
GABA (red), NAAG (green), NAA (purple), Gln (yellow), Glu (blue), Glu (blue) and macromolecule (MM: orange), which were estimated from LCModel. Top panel indicates residual, which is a difference between in-vivo and fitting lines. Directly observable GABA-2CH2 resonance at 2.28 ppm plays an important role in the GABA quantification with spectral fitting. GABA estimation is limited by the 2.28 peak, which is the true GABA. It prevents over-estimating GABA by co-edited macromolecule. Note that the bottom part of the NAA signal is truncated in this figure.

