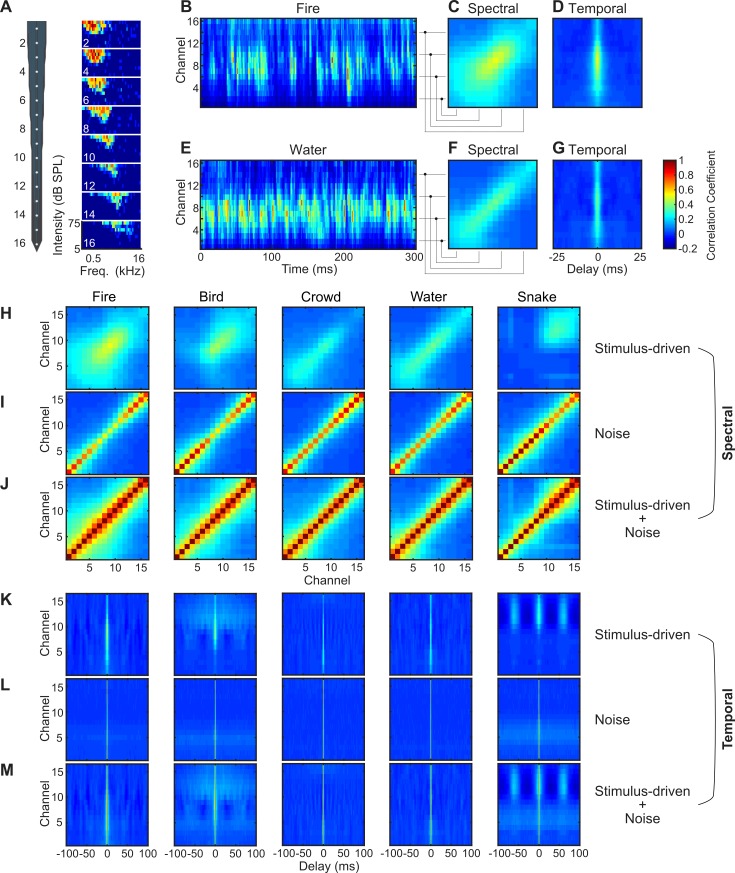
Fig 1. Neural ensemble correlation statistics for an auditory midbrain penetration site.
(A) Neural recording probe and the corresponding frequency response areas at 8 staggered recording sites show tonotopic organization (red indicates high activity; blue indicates low activity). aMUA for the 16 recording channels for a (B) fire and (E) water sound segment (red indicates strong response; blue indicates weak response). The spectral (C = fire; F = water) and temporal (D = fire; G = water) neural ensemble correlation for the penetration site. Stimulus-driven spectral (H) and temporal (K) correlations of the recording ensemble show distinct differences and unique patterns across the five sounds tested. Spectral (I) and temporal (L) noise correlations recorded during the same sound delivery sessions are substantially less structured (diagonalized spectrally and restricted across time) and show little stimulus dependence. The total spectral and temporal ensemble correlations (stimulus-dependent + noise) are shown for the same site and sounds in J and M, respectively. Additional examples penetration sites are provided in S2–S4 Figs. Figure data and related code are available from http://dx.doi.org/10.6080/K03X84V3. aMUA, analog multiunit activity; SPL, sound pressure level; Freq., frequency.

