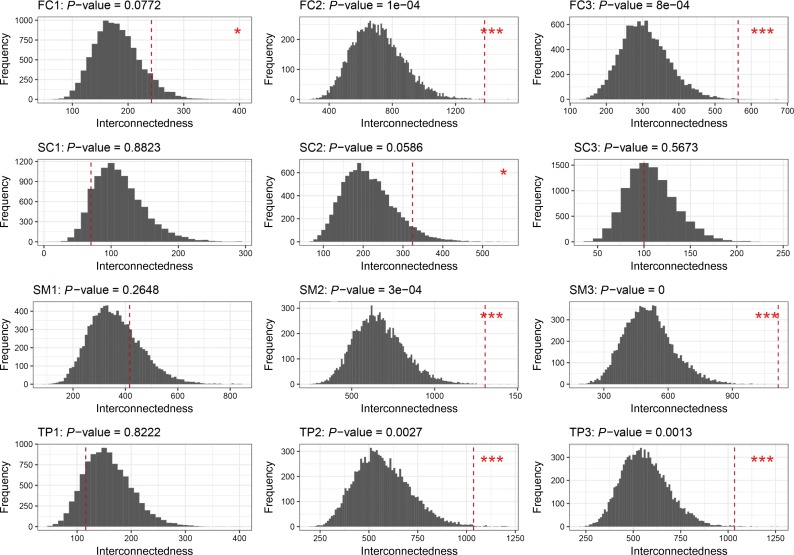
Figure 1.
The P-values of the interconnectedness of the 108 candidate genes in the 12 spatial-temporal brain developmental gene networks. The subplots of each row correspond to four anatomical regions—frontal cortex (FC; first row), subcortical regions (SC; second row), sensory-motor regions (SM; third row); and temporal and parietal regions (TP; fourth rows). The subplots of each column showed the three brain developmental stages— fetal (period 1: 8–37 post-conception weeks; front column), early infancy to late childhood (period 2: 4 months to 8 years; middle column); and adolescence to adulthood (period 3: 13–40 years; last column). Each subplot presents the empirical distribution of interconnectedness of 108 genes which drawn randomly from 718 schizophrenia risk genes. The empirical distributions were generated by resampling 10000 times at each spatial and temporal period. The red vertical dashed line in each subplot shows the interconnectedness of the 108 candidate genes. The P-values of the interconnectedness of the candidate genes were calculated as the fraction of the interconnectedness of 10000 sets larger than the observed interconnectedness (corresponding to column “p-0.8w” of Supplementary Table S4). The spatio-temproal networks with 108 candidate genes presented significant at P-value < 0.01 were annotated with *** and at P-value < 0.1 were annotated with *.

