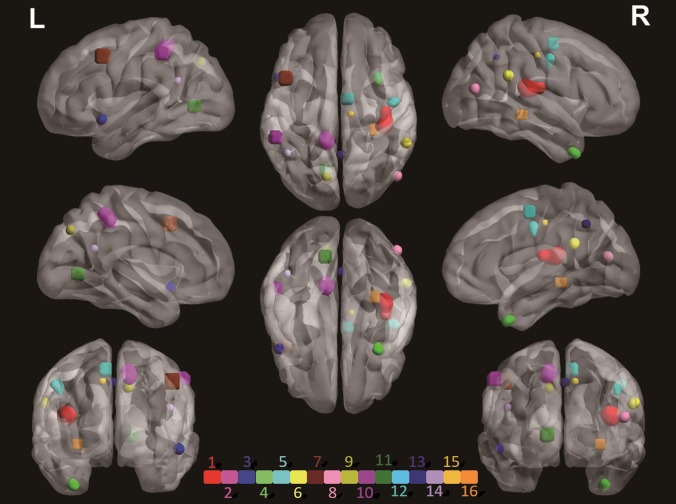
Figure 2.
3D image of the 16 HCs identified. The HCs were denoted as “HC1”, “HC2”,…, “HC16” according to Table 1. Each HC is represented with a unique color. The coronal views of each cluster are shown in Supplementary Figure S2, with intensity representing the corrected weight of each voxel. The exact location and the related genes of each HC are provided in Table 1 and Supplementary Table S5.

