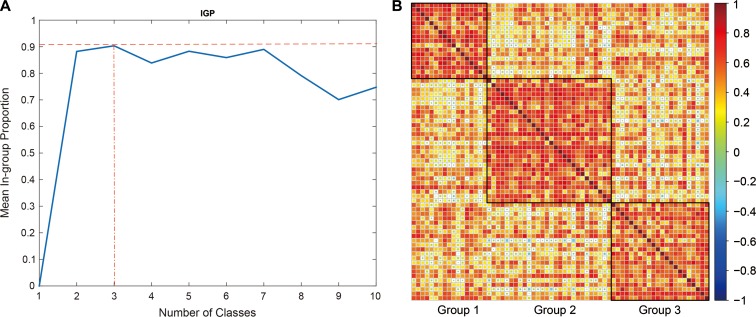
Figure 3.
Identification of subtype patients by GMV of HCs. (A) The number of classes against mean in-group proportion (IGP). The optimum number of classes (groups) is identified by maximizing IGP. (B) Heat map of the three groups identified according to grey matter densities (GMVs) of the 16 HCs. The patients were sorted by groups. The colors represent the correlation coefficient (as displayed in the color bar) of GMVs over 16 HCs of two corresponding patients.

