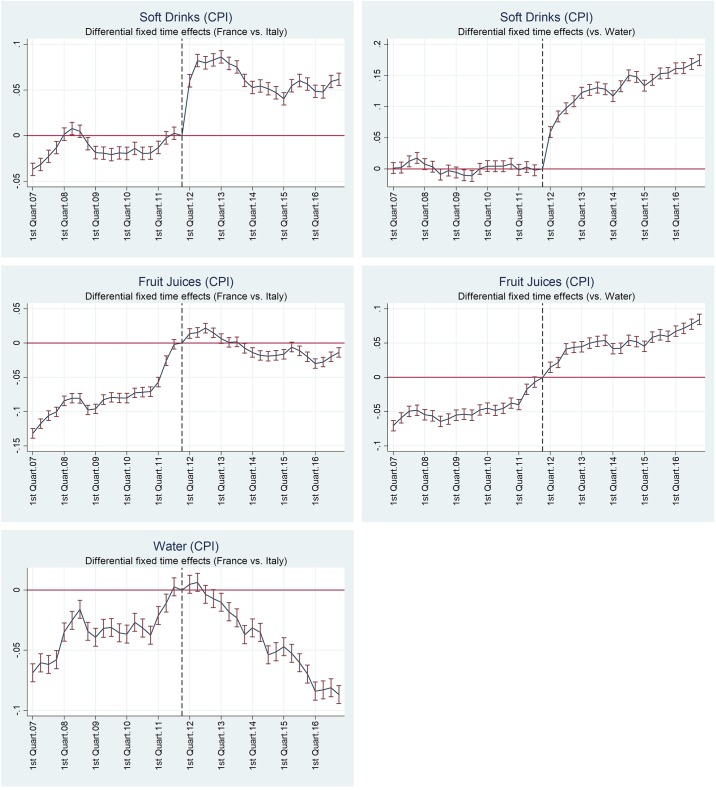
Fig 2. Differential fixed time effects in real consumer price indices, 2007-16.
The graphs show the estimated differential fixed time effects for France relative to Italy (left graphs) and for each good relative to mineral and spring water CPIs (right graphs) according to Eqs (3) and (4), respectively. Time effects are relative to December 2011 = 0, bars show the 95% confidence intervals.

