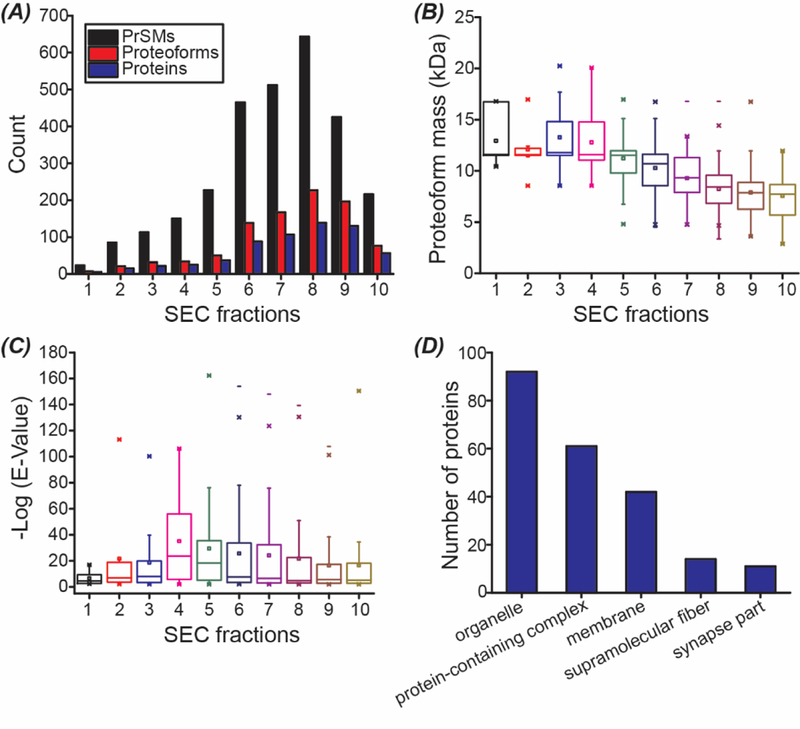
Figure 2.

Summary of the SEC-CZE-UVPD data. (A) Numbers of proteoform spectra matches (PrSMs), proteoforms, and proteins vs. SEC fractions. (B) Box-plots of the masses of proteoforms identified from each SEC fraction. (C) Box-plots of the –log (E-Value) of identified proteoforms from each SEC fraction. (D) Cellular component distribution of identified proteins. The information was obtained from the UniProt website using the Retrieve/ID mapping tool.
