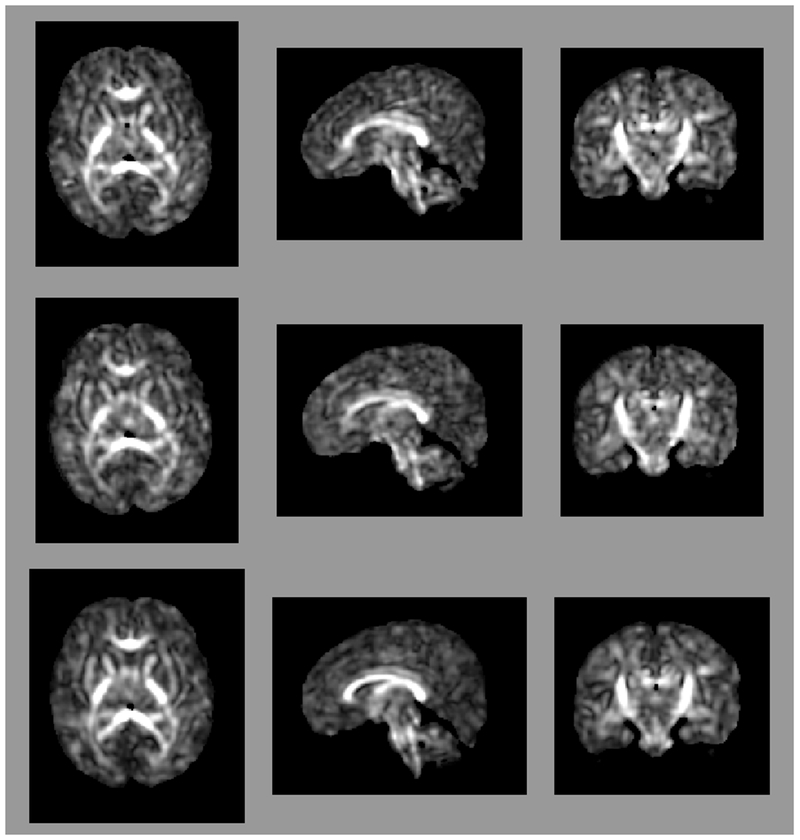
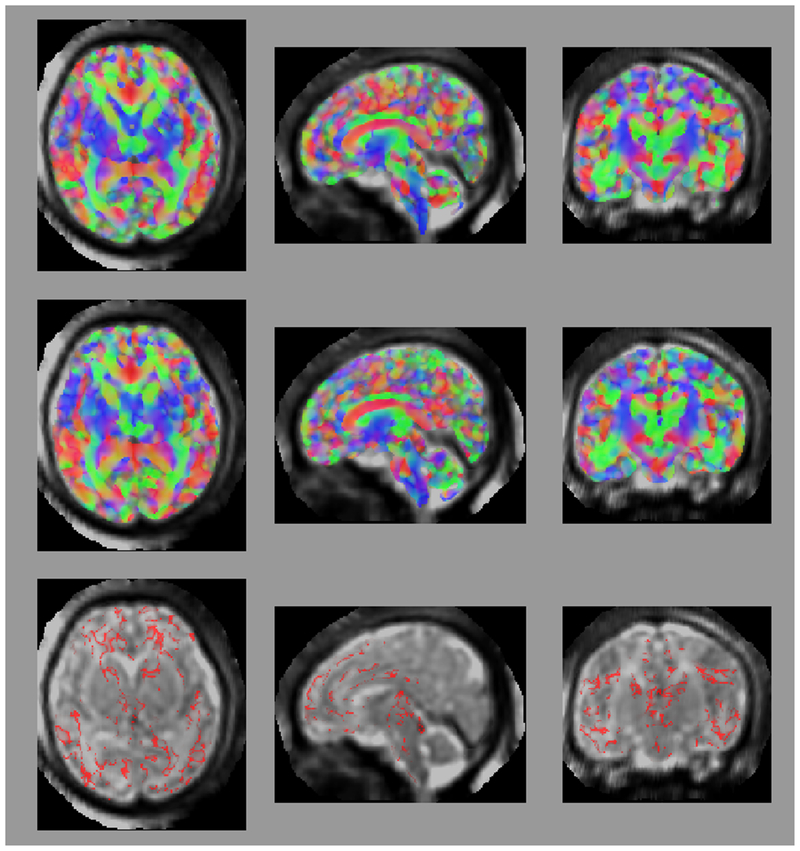
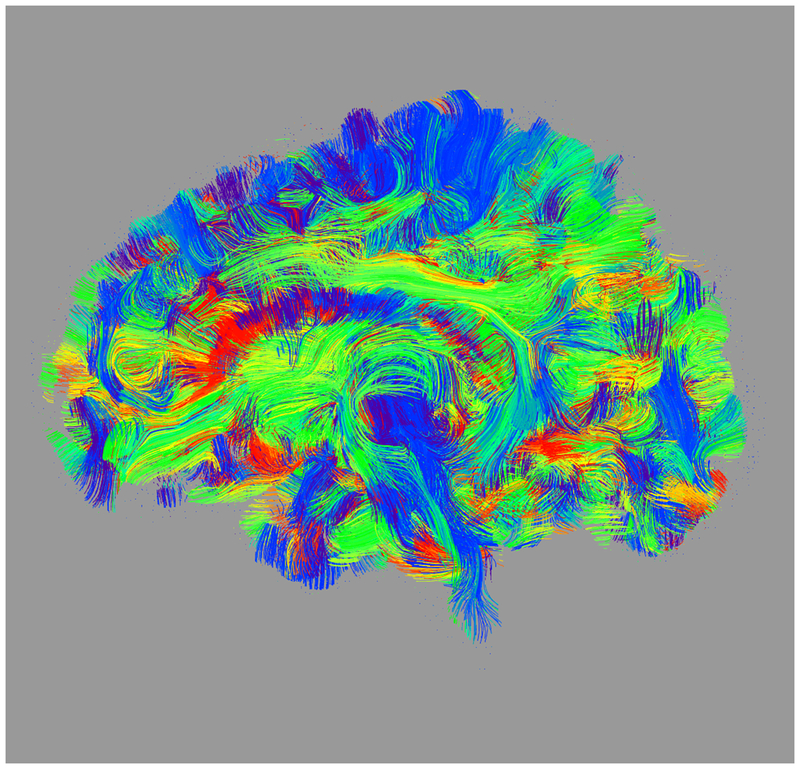
Figure 1:
Axial (left column), sagittal (center column), and coronal (right column) views of (a) fractional anisotropy (FA) and (b) principal diffusion direction (weighted by FA) for the test (top row) and retest (middle row), with highlighted angular difference (bottom row), scaled from 0 to π/10. Grayscale range in (a) from FA = 0.0 (black) to FA = 0.4 (white). Colors in (b) show the principal direction of diffusion (red: left-right, green: anterior-posterior, blue: superior-inferior). (c) Whole brain tractography for the test subject. Colors indicate the mean direction of the fiber.


