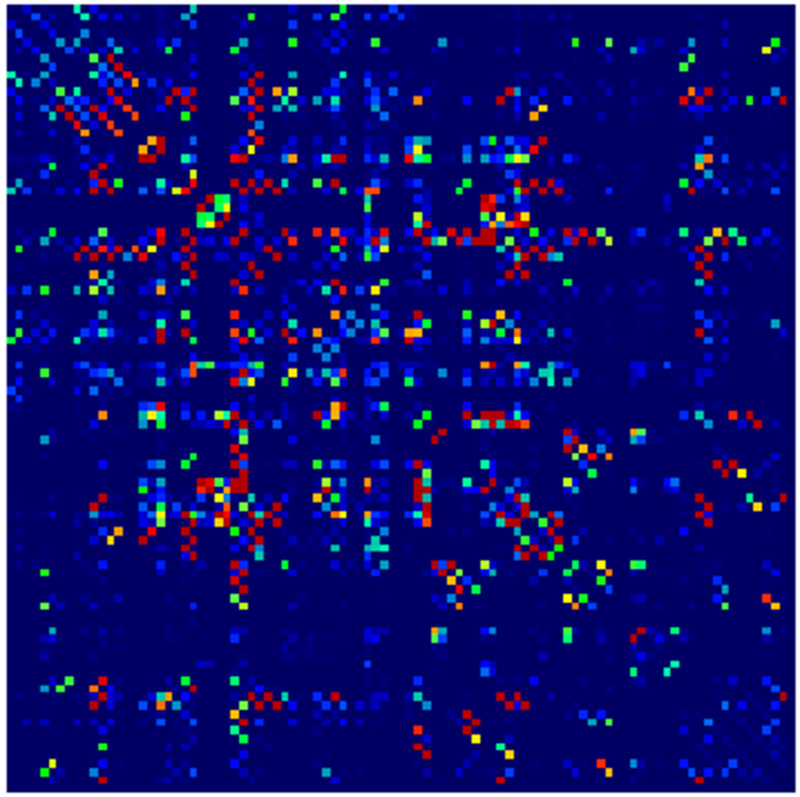
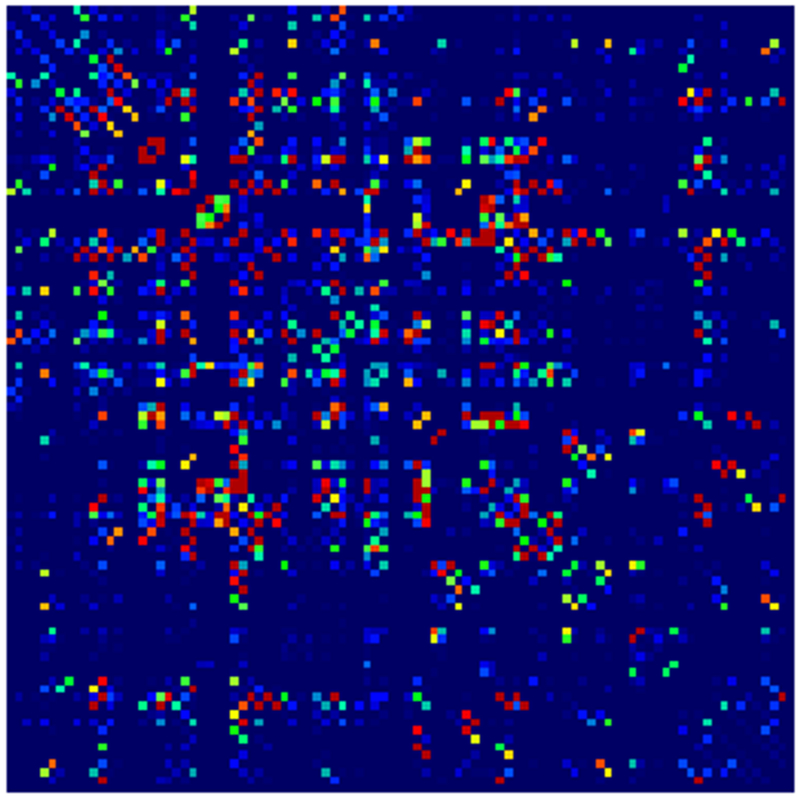
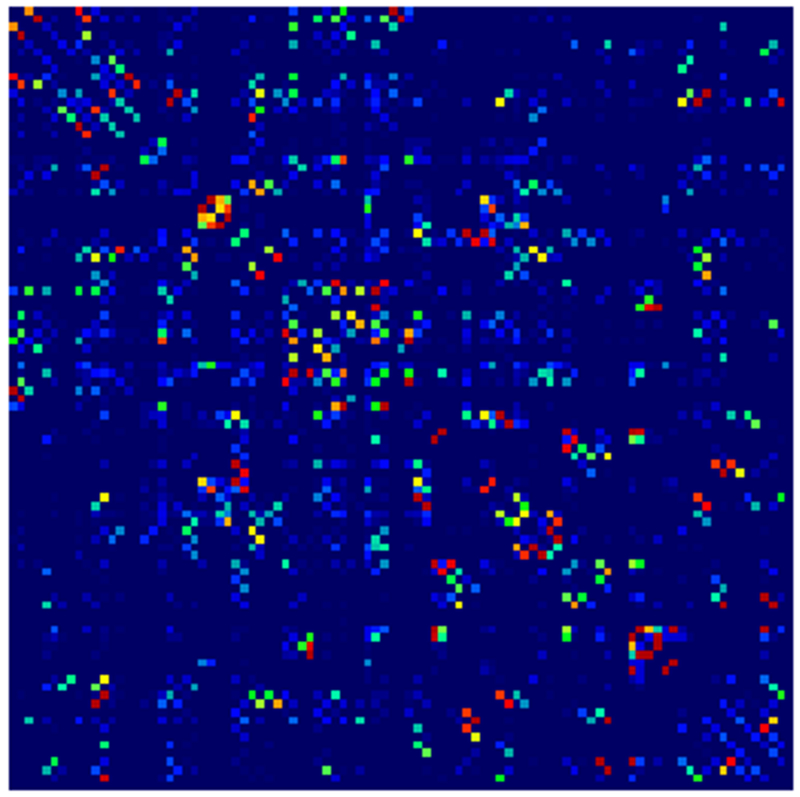
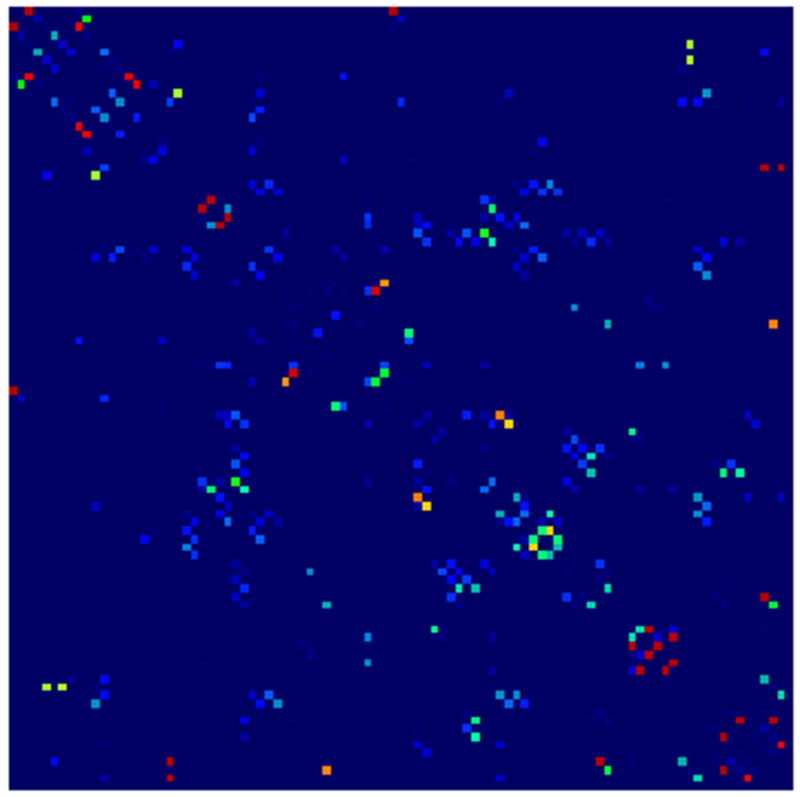
Figure 4:
Adjacency matrices for four graph constructions: (a) fiber count, (b) mean FA, (c) fiber count with volume correction, and (d) fiber count with length correction. Color represents normalized edge strength (all edges scaled by largest edge strength) from low strength (0.0) in blue to higher relative strength (0.1) in red.


