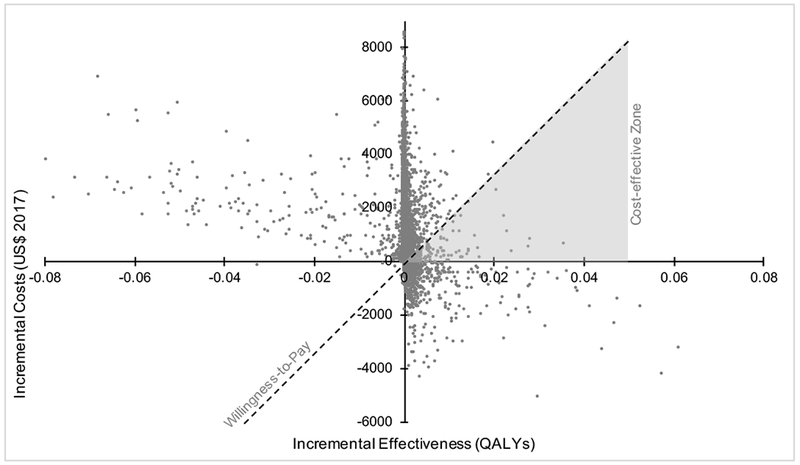
FIGURE 4.

Multivariable probabilistic sensitivity analysis of incremental cost-effectiveness ratio comparing extended venous thromboembolism prophylaxis following surgery for Crohn’s disease versus hospital-only prophylaxis.
NOTE: The x-axis is the additional quality adjusted life years gained with extended prophylaxis versus routine care. The y-axis is the additional costs with extended prophylaxis versus no extended prophylaxis. Each data point represents one of 10,000 iterations of the model with random, probability-distributed variation in model parameters. The dashed line represents a $150,000 per QALY willingness to pay threshold, selected by convention. All data points below the willingness-to-pay threshold represent cases that are cost-effective supporting extended prophylaxis; all points above the line represent cases where no extended prophylaxis is the cost-effective strategy. Furthermore, points in the upper left quadrant are cases where extended prophylaxis reduces total QALYs and is more expensive. Points in the lower right quadrant are cases where extended prophylaxis both increases total QALYs and reduces costs. Thus, the gray shaded region is the only portion of the diagram where cost-effective scenarios for extended prophylaxis will fall. Appendix 3 further highlights that over 88% of all points fall above the willingness-to-pay threshold favoring no extended prophylaxis. For readability, extreme outliers representing less than 5% of the simulated sample have been omitted.
