
Fig.5. Loss of miR-199a associates with arsenic-mediated energy metabolic shift.
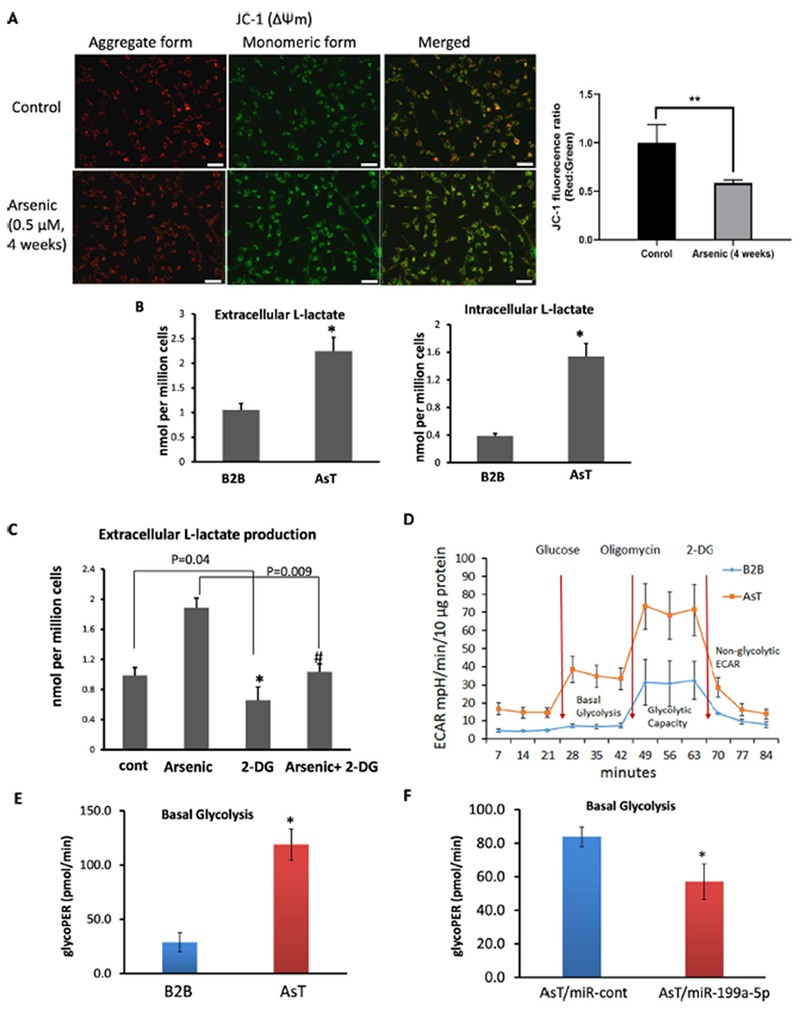
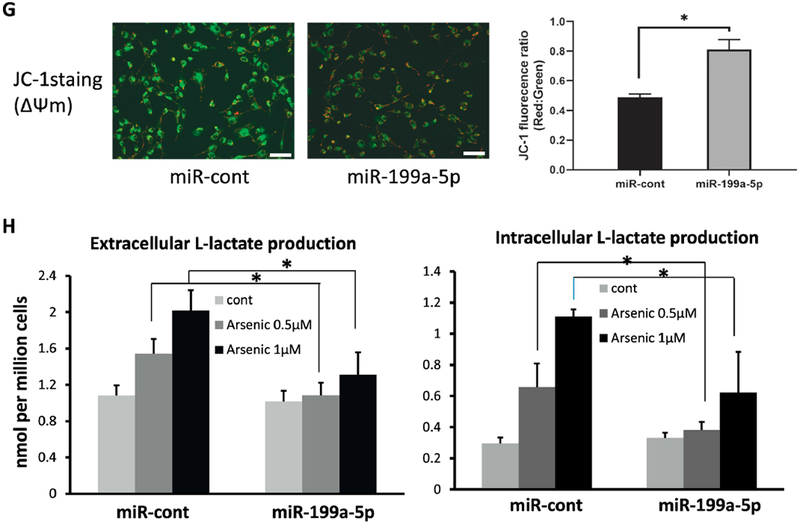
(A) Mitochondria membrane potential was evaluated by JC-1 dye in BEAS-2B cells exposed to sodium arsenic for 4 weeks (0.5 μM) and control cells. Representative images by fluorescence microscope were shown (left). Red fluorescence represents J-aggregates, indicating high mitochondrial membrane potential (ΔΨm). Green fluorescence represents monomers, indicating impaired mitochondrial membrane potential (ΔΨm). Scale bar= 100 μm. Quantification analysis for fluorescence was shown (right) (B) Extracelluar and intracellular Lactate productions were measured in culture medium or cells, respectively in AsT cells and B2B cells. (C) BEAS-2B cells exposed to arsenic for 4 weeks (0.5 μM) were treated with 2-DG for 24 h at 2 mM. Extracellular L-Lactate level was measured. (D, E) Extracellular acidification rate (ECAR) was determined by Seahorse assay in AsT cells and B2B cells. The basal glycolysis results were generated by the XF Report Generator based on the Seahorse glycolysis stress assay. (F) ECAR was determined by Seahorse assay in AsT cells overexpressing miR-199a-5p or miR-control. (G) AsT cells were transfected with miR-199a-5p mimic or scrambled control miR-cont for 96 h. Cells were stained with JC-1 dye. Representative images showed the merged red fluorescence (aggregate form) and green fluorescence (monomeric form). Scale bar: 100 μm. (H) BEAS-2B cells exposed to arsenic at the doses of 0.5 or 1μM for 4 weeks were transfected with miR-199a-5p mimic or miR-cont for 72 h. Extracellular and intracellular L-Lactate level was measured in culture medium or cell lysates. Data are presented as mean±SD, * P<0.05, compared with control cells.