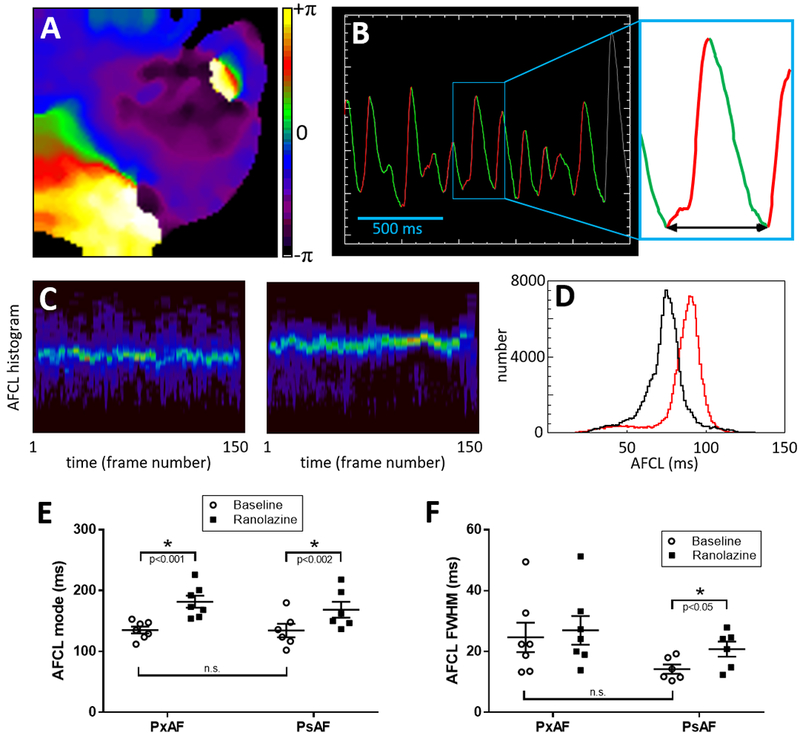
Figure 7: AF cycle length (AFCL) during stretch-induced paroxysmal (Px) and tachypacing-induced persistent (Ps) AF.

(A) Representative phase map during PsAF. (B) Representative single-pixel optical voltage recording during PsAF displaying automated detection of upstroke (red) and downstroke (green). AFCL is measured for each activation between consecutive nadirs (arrow in inset). For each movie frame a histogram is constructed to measure AFCL distribution. (C) All histograms from a movie are stacked vertically into 3D histograms with brighter colours representing count numbers. Left and right panels show representative stacked histograms of PsAF before and during application of ranolazine, respectively. For each movie, stacked histograms are averaged across all frames. (D) Representative average AFCL histograms from the same heart in PsAF before (black) and during (red) application of ranolazine show prolongation of mean and mode AFCL with ranolazine. (E) Quantification of AFCL shows ranolazine prolonged AFCL in both PxAF and PsAF. (F) Quantification of full width at half maximum (FWHM) as an index of variance of average AFCL histograms (lines indicate mean±SEM).
