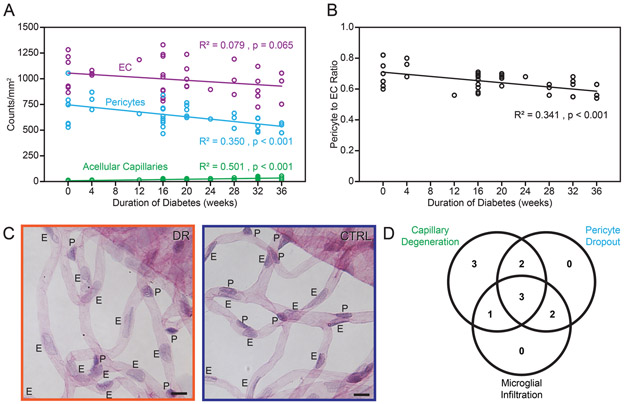
Figure 2.
Early retinal cellular changes in diabetic Nile rats. Cell number trends of endothelial cells, pericytes and acellular capillaries (A) and pericyte to endothelial cell ratios (B) as diabetes progresses. N = 48 rats from 20 to 44 weeks old C: Micrographs showing evidence of pericyte loss - diabetic retina on the left and age-matched control on the right. E = endothelial cells. P = pericytes. Pericytes have smaller dark-staining nuclei compared to endothelial cells, which have larger nuclei with lighter staining. Orange outline = diabetic retinopathy. Blue outline = control. D: A Venn diagram with the number of diabetic Nile rats having the respective conditions. Diabetic rats were defined as having each of the three conditions by using a cutoff calculated from the average count of the controls plus one standard deviation (n = 11 diabetic rats and 11 control rats).

