Figure 3.
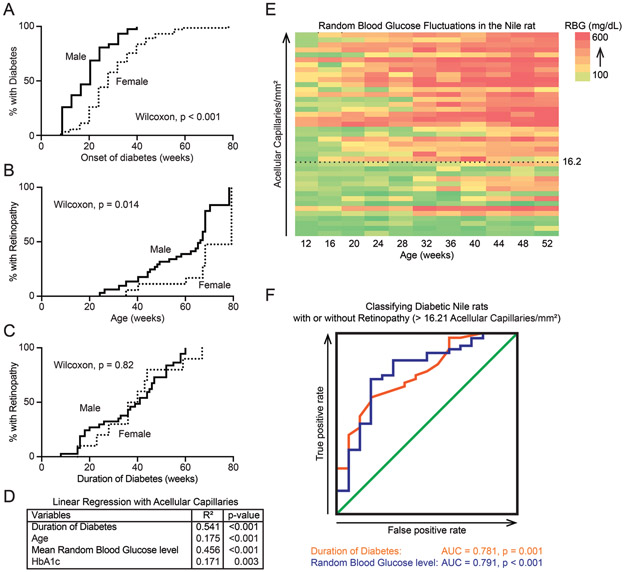
Progression of retinopathy in diabetic Nile rats. A: A Kaplan-Meier graph showing the percentage of male rats (n = 111) and female rats (n = 113) developing diabetes over time. Males and females differed significantly (Wilcoxon test, χ2 = 25.12, p < 0.001). B: A Kaplan-Meier graph showing the percentage of diabetic male rats (n = 43) and female rats (n = 13) developing retinopathy over time. Males developed retinopathy at significantly earlier ages (Wilcoxon test, χ2 = 6.383, p < 0.05). C: A Kaplan-Meier graph presenting the same cohort of animals as panel B but normalized to duration of diabetes. Both sexes take roughly the same duration of diabetes to develop retinopathy (Wilcoxon test, χ2 = 0.05, p = 0.82). D: A summary of linear regression statistics between multiple variables and the number of acellular capillaries. E: A heat map showing RBG fluctuations across age (n = 41), sorted by increasing number of acellular capillaries. 16.2 acellular capillaries is the cutoff used to define diabetic Nile rats with retinopathy. F: Two ROC curves depicting the usefulness of “duration of diabetes” or “mean RBG” as classifiers of retinopathy in diabetic Nile rats. AUC = area under the curve.

