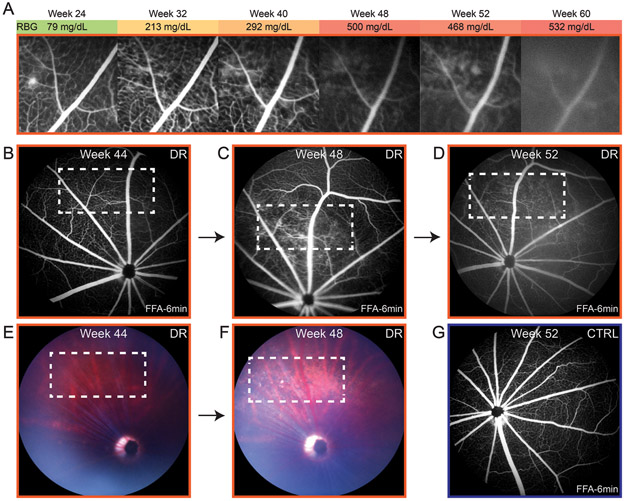
Figure 4.
Retinal vascular leakage in diabetic Nile rats. A: The progression of retinal leakage in a diabetic Nile rat. The reduced clarity of the FFA from 48 weeks onwards was not from continued leakage but rather, from cataract forming in that eye. In another diabetic rat, the area of progressive leakage (B-D) is shown with the corresponding fundus images (E and F). The white outline marks the area where leakage developed. G: An age-matched control to the diabetic rat in panel D. Orange outline = diabetic retinopathy. Blue outline = control.

