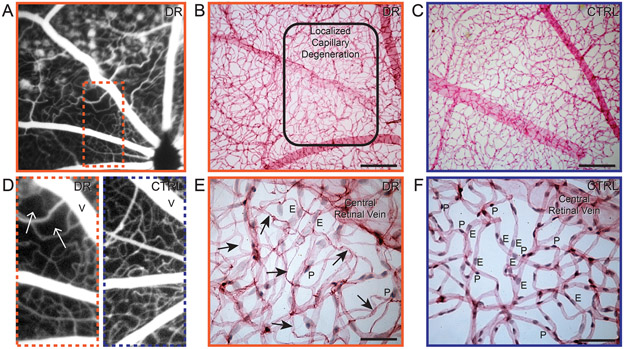
Figure 5.
Capillary non-perfusion in diabetic Nile rats. A: FFA of a 52-week-old Nile rat exhibiting leakage and capillary non-perfusion (inset dotted line). D: A magnified version of the orange dotted rectangle in panel A juxtaposed with a similar region in the retina of an age-matched control on the right. B: A trypsin digest of the same retina as panel A but eight weeks later, at 60 weeks old. The rounded rectangle shows the border of capillary non-perfusion, magnified in panel E. An age-matched control of panel B is shown in panel C, magnified in panel F. Scale bars for panels B and C = 200 μm. Scale bars for panels E and F = 50 μm. V = central retinal vein. Arrow = acellular capillary. E = endothelial cell. P = pericyte. Orange outline = diabetic retinopathy. Blue outline = control.

