Figure 7.
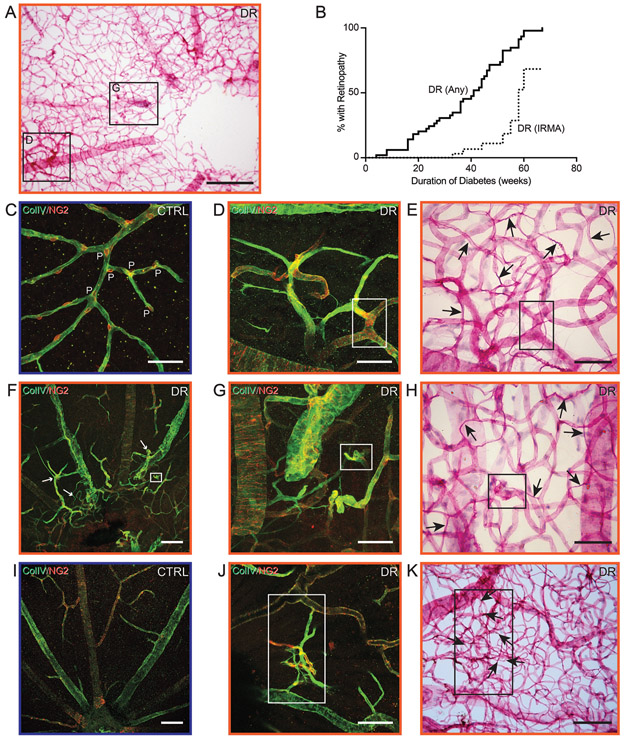
Intraretinal microvascular abnormalities in diabetic Nile rats. A: A retinal trypsin digest of a diabetic Nile rat with multiple regions of microvascular abnomalities. Insets are magnified as panels D and G. Scale bar = 200 μm. B: A Kaplan-Meier graph showing the percentage of diabetic Nile rats developing any retinopathy (>16.21 acellular capillaries/mm2) versus a proportion of them developing intraretinal microvascular abnormalities (confirmed by immunohistochemistry and trypsin digests). C: An age-matched control exhibiting evenly spaced pericytes along the retinal capillaries. P = pericyte. D: Loss of pericytes and abnormal branched capillaries. E: Same area as panel D, after trypsin digest. The insets in panels D and E mark the same vessel. F: Aberrant retinal vessels surrounding the optic nerve head, highlighted by white arrows. Age-matched control depicted in panel I. G: Magnified from panel F. H: Same area as panel G, after trypsin digest. The insets in panels F, G and H mark the same vessel. J: Another area with intraretinal microvascular abnormalities from the same retina but not within the field of view in panel A. K: Same area as panel J, after trypsin digest. The insets in panels J and K mark the same vessels. Black arrows = acellular capillaries. Scale bars in C-E, G, H, J and K = 50 μm. Scale bars in F and I = 100 μm.

