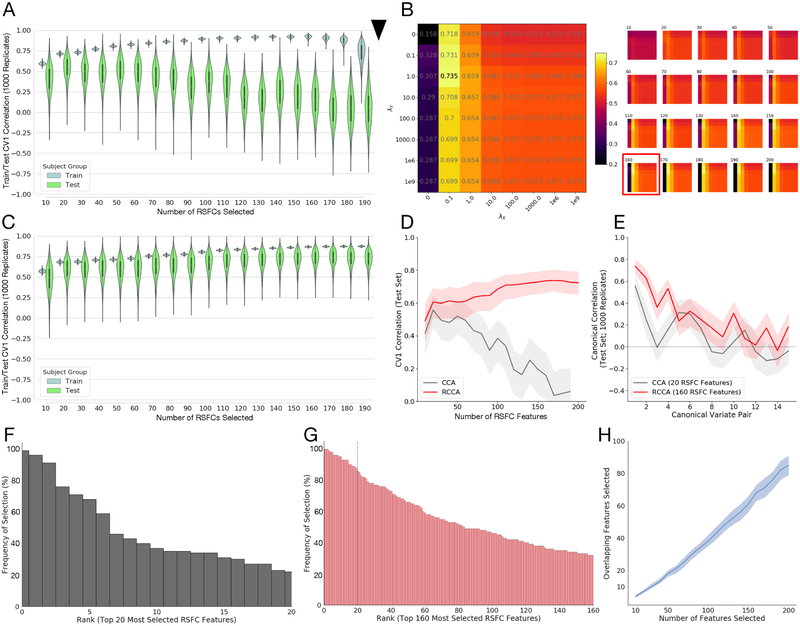
Figure 2: Stable train/test canonical correlations between RSFC features and clinical measures are improved by regularization.
A) Violin plots (with superimposed boxplots) of correlations between the first canonical variates of a standard Canonical Correlation Analysis (CCA) on training data (90% of subjects) and test data (10% of subjects) for a range of features (10 to 190 by increments of 10) selected using the correlation method proposed in (18), with this procedure bootstrapped 1000 times for each number of features to yield the plotted distributions. Feature selection and CCA fitting was done on training data, separately for each bootstrap replicate, and then estimated CCA coefficients applied to the selected features in the held-out validation set to obtain test correlations. Test correlations for CCA peak at 20 features selected. Black arrow: standard CCA cannot be fit to more correlations than there are observations (in this case 90% of n=220, or 198 subjects). B) Median test rates fit over a grid of regularization parameters λX, λY for each number of features selected. (Left) The grid corresponding to the best test correlations corresponding to using 160 RSFC features. The color of each square in the grid corresponds to the median test correlation (also printed in grey in the center of each square; colorbar at right gives hue values). (Right) Similar grids for other numbers of RSFC features (number of features selected shown above grid, test correlations shown in color only, not text). The best fit (160 features; shown on the left) is boxed in red box in the full set of fits on the right. Fitting more than 198 coefficients is possible. C) Violin plots (with superimposed boxplots) of correlations between the first canonical variates of the Regularized Canonical Correlation Analysis (RCCA) with the best regularization parameters (λX = 0.1, λY = 1, NF = 160) on training data (90% of subjects) and test data (10% of subjects) for the various numbers of features selected using the correlation method proposed in (18) (resampled 1000 times), as in A. Fitting more than 198 coefficients is possible. D) Test rates for the first canonical variate (CV1) as a function of the number of features selected for CCA (grey) and RCCA (red); shaded region shows 1st through 3rd quartile for the replicate fits. E) Test correlations between canonical variates 1–15 for the best fit from A (CCA fit in grey; 20 features), and the best fit from C (RCCA fit in red; 160 features); shaded region shows 1st through 3rd quartile for the replicate fits. F) Ordered (by top rank) histogram of the top 20 features chosen by the feature selection approach (from (18)) showing the percentage of times they were chosen across the 1000 subsampled replicate data sets. Just 3 features are selected more than 80% of the time. G) Ordered (by top rank) histogram of the top 160 features chosen by the feature selection approach showing the percentage of times they were chosen across 1000 subsampled replicates. 25 features appearing more than 80% of the time, dotted line denotes top 20 features; compare with F. H) Number of overlapping features in all pairwise combinations of 100 randomly chosen replicates as a function of number of features selected (dark blue line shows median and shaded region 1st through 3rd quartile across replicates). The median number of overlapping features selected increases approximately linearly with the total number of features selected.

