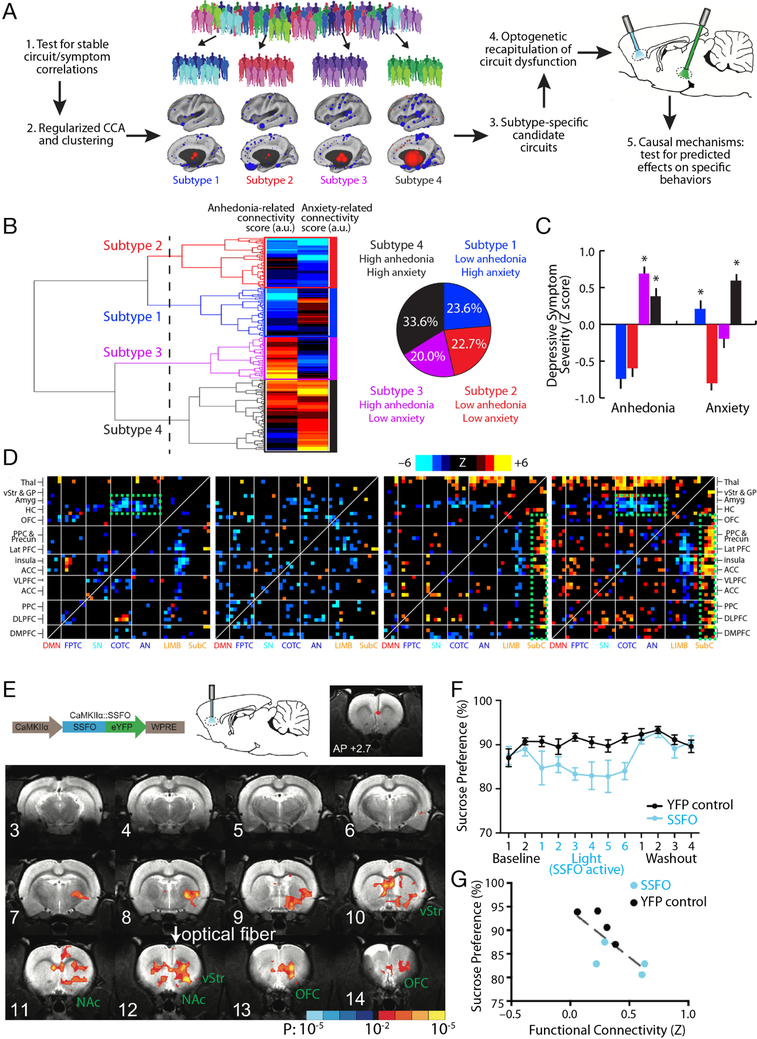
Figure 3. Optogenetic fMRI for interrogating subtype-specific circuit mechanisms in depression.
A) Schematic illustration of a model for formulating hypotheses regarding subtype-specific mechanisms driving depressive symptoms and behaviors, and testing them in animal models using optogenetic fMRI. By first testing for robust and stable RSFC-clinical symptom correlations as in Fig. 1 and then using CCA and hierarchical clustering, relatively homogeneous subgroups of a heterogeneous MDD sample can be identified. These subgroups can be used to identify subtype-specific candidate circuits (see main text), and ofMRI can be used to test hypotheses about dysfunction in specific circuits driving specific behaviors, while also validating whether the RSFC effects evoked by the optogenetic manipulation resemble those observed in human subjects. B) In Ref. (18), hierarchical clustering on two canonical variates representing anhedonia- and anxiety-related RSFC revealed at least four clusters of patients in these two dimensions. The height of each linkage in the dendrogram represents the distance between the clusters joined by that link. The dashed line denotes 20 times the mean distance between pairs of subjects within a cluster. C) The four subtypes predicted significant group differences in anhedonia and anxiety (P < 0.005, Kruskal Wallis ANOVA) as indexed by item-level responses on the HAMD (item 7 and 11, respectively). Symptom severities are Z-scored with respect to the mean and standard deviation of all patients in the sample. Error bars = S.E.M. D) Heatmaps depicting subtype-specific patterns of altered functional connectivity for the top 50 neuroanatomical ROIs with the most subtype-specific RSFC features by Kruskal Wallis ANOVA. The color scale represents Wilcoxon rank sum test scores for the difference between patients in each subtype and matched healthy controls. The green boxes denote RSFC features discussed in the main text. For additional details on panels B-D, see Ref. (18). E) In Ref. (55), a viral vector (AAV/CaMKIIa/SSFO) driving SSFO expression in projection neurons was injected into mPFC, and an optical fiber implanted over the mPFC target was used to activate (blue light) and inactivate (amber light) the opsin during alternating rsfMRI scanning periods (300 s per scan). SSFO activation induced a pattern of increased functional connectivity between an mPFC seed (denoted by the red dot) and a network of structures depicted here, where colors denote the Z statistic (and associated P value) for RSFC changes in the opsin-on vs. opsin-off conditions (N = 4 rats, 14 runs). NAc = nucleus accumbens; OFC = orbitofrontal cortex; vStr = ventral striatum. F) Subjects (N = 8 SSFO rats, blue; N = 10 control rats, black) were assessed on the sucrose preference test during a 2-day baseline period, followed by 6 days with SSFO activated, followed by a 4-day “washout” period with SSFO off. SSFO activation reduced sucrose preference behavior (F(11,176) = 2.56, P = 0.0051, two-way repeated measures ANOVA), compared to subjects expressing a YFP control construct. G) Individual differences in RSFC between the mPFC seed and the ventral striatum correlated with sucrose preference behavior (R2 = 0.56, P = 0.03). Panels B-D and E-G were adapted from Refs. (18) and (55), respectively. See corresponding references for additional details.

