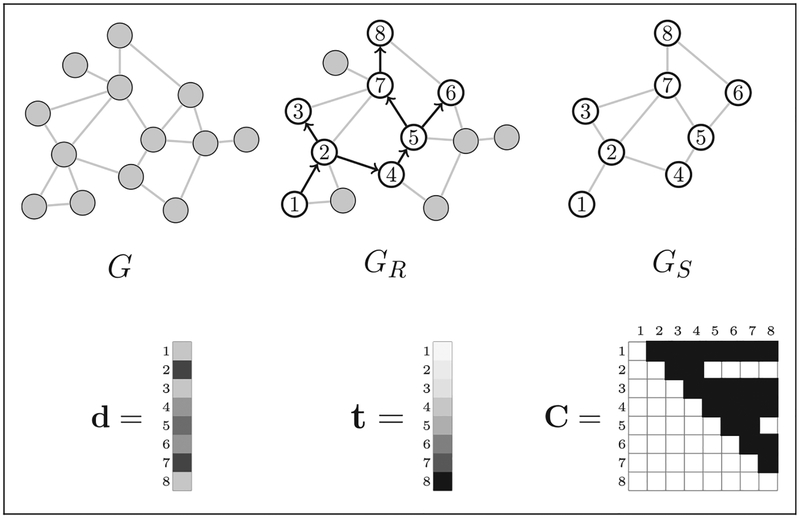
Figure 1.
Example of unobserved and observed data in respondent-driven sampling (RDS). The true hidden population network is G. One seed is chosen (the vertex marked 1), and the RDS recruitment proceeds with each recruited vertex receiving two coupons. The directed recruitment graph GR is shown superimposed on G. The recruitment-induced subgraph GS is the subgraph of the recruited vertices. The degrees d = (d1, …,d8) of each recruited vertex are observed, along with the recruitment times t = (t1, …,t8). The coupon matrix C shows which recruiters had at least one coupon just before each recruitment event. In RDS, researchers observe neither G nor GS; the observed data consist of Y = (GR, d, t, C).

