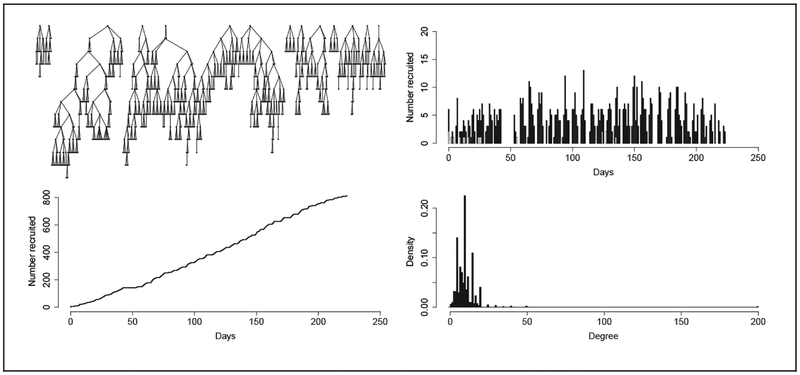
Figure 3.
Raw data from a respondent-drivien sampling (RDS) sample of n = 813 people who inject drugs in St. Petersburg, Russia. In the top left panel, 14 RDS recruitment chains originating from different seeds are shown. Recruited subjects are organized into “waves” along the vertical axis. The top right panel shows the number of subjects interviewed on each day of the study, with seeds indicated by gray bars. The bottom left panel shows the cumulative number of recruits over the course of the study, and the bottom right panel shows a histogram of the reported degrees of subjects, with bin size 1.

