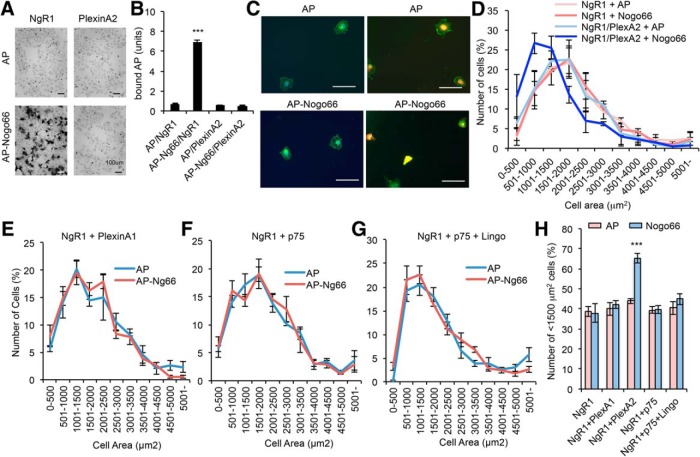
Figure 4.
NgR1/PlexinA2 complex is sufficient for Nogo-A-induced Cos7 cell contraction. A, Cos7 cells transfected with NgR1 or PlexinA2 were cultured for 36 h and incubated with AP or AP-tagged Nogo66 for 60 min. Binding was visualized with AP substrate BCIP/NBT (left). Scale bars, 100 μm. B, AP substrate density was measured using ImageJ. Error bars represent SEM; n = 10. ***p < 0.005, one-way ANOVA followed by Tukey's test. C, Cos7 cells were transfected with NgR1 or NgR1 plus HA-PlexinA2. After 12 h, the cells were re-plated onto 96-well plates at 150 cells per well and grown for an additional 24 h. Then, cells were incubated with AP or AP-tagged Nogo66 for 60 min and stained with NgR1 (green) and HA (red). Scale bars, 100 μm. D, The NgR1-positive cell area was measured with using ImageJ. Data are presented as the mean ± SE; n = 3. E–G, Cos7 cells were transfected with NgR1 plus PlexinA1 (E), p75 (F), or p75 and Lingo (G). After 12 h, the cells were re-plated onto 96-well plates at 150 cells per well and grown for an additional 24 h. Then, cells were incubated with AP or AP-tagged Nogo66 for 60 min and stained with NgR1 and NgR1-positive cell area was measured with using ImageJ. Data are presented as the mean ± SE; n = 3 (E), n = 5 (F, G). H, Cos7 cells transfected with indicated plasmids were incubated with AP or AP-Nogo66, and cells were fixed and stained with NgR1 antibody. NgR1-positive cell area was measured using ImageJ and number of <1500 μm2 cells was summarized. Error bars represent SEM; n = 3 (NgR1, NgR1+PlexinA2, NgR1+PlexinA2), n = 4 (NgR1+p75, NgR1+p75+Lingo).***p < 0.005, one-way ANOVA followed by Tukey's test.

