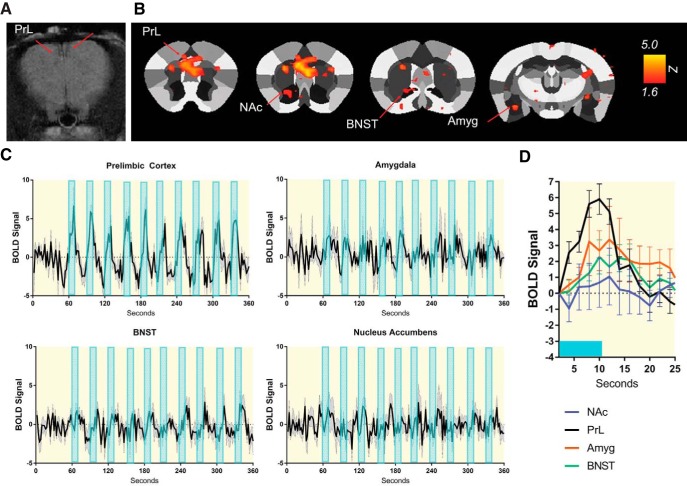
Figure 4.
Optogenetic activation of OXTR-expressing neurons in the PFC produces excitatory responses in multiple brain areas as revealed by fMRI. A, Representative coronal scan through the mouse PFC depicting the placement of chronic dwelling fiber optic implants just dorsal to the PFC. B, BOLD activation maps aligned and overlaid onto a segmented atlas of the mouse brain. Maps were cluster-thresholded (p < 0.05). Arrows indicate areas that had significantly activated voxels. C, Time series BOLD responses to light stimulation in the PrL, amygdala, NAc, and BNST. D, Averaged BOLD waveforms during the window of B. Amyg, Amygdala; PrL, prelimbic cortex.

