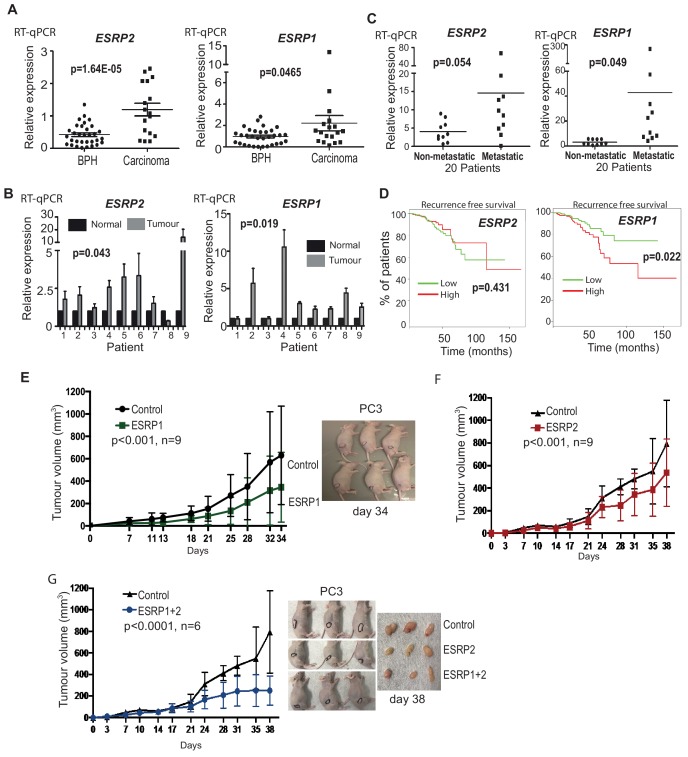
Figure 2. ESRP2 and its paralog ESRP1 are highly expressed in primary prostate tumours.
(A) Real-time PCR analysis of ESRP1 and ESRP2 mRNA from patients with benign prostate hyperplasia (BPH) and 17 malignant samples from transurothelial resection of the prostate (TURP) samples. (B) Real-time PCR analysis of ESRP1 and ESRP2 mRNA from normal and matched prostate cancer tissue from nine patients obtained from radical prostatectomy. (C) Analysis of ESRP1 and ESRP2 mRNA levels in samples from the Walker et al. (2017) cohort. Statistical analysis in parts (A)-(C) were performed using t tests. (D) Interrogation of the TCGA PRAD (PRostate ADenocarcinoma) cohort using KM-express (Chen et al., 2018). ESRP1 expression levels linked to a reduced time to PSA biochemical recurrence (bifurcate gene expression at average, log-rank test p=0.022). Over-expression of (E) ESRP1, (F) ESRP2, or (G) both ESRP1 and ESRP2 in PC3 cells significantly slowed the growth of prostate cancer xenografts in vivo. Data were analysed by Two-way ANOVA, and the p value is for the overall difference between two groups.


