
Figure (2).
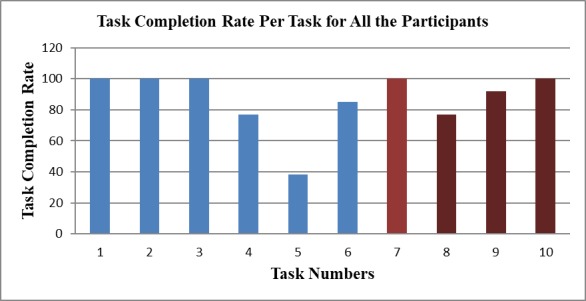
Task Completion Rate Per Task for All the Participants. Blue indicates tasks involving the Area Health Profile (Tasks 1–6); red indicates tasks involving the Double Map (Tasks 7–10)
Official websites use .gov
A
.gov website belongs to an official
government organization in the United States.
Secure .gov websites use HTTPS
A lock (
) or https:// means you've safely
connected to the .gov website. Share sensitive
information only on official, secure websites.
Task Completion Rate Per Task for All the Participants. Blue indicates tasks involving the Area Health Profile (Tasks 1–6); red indicates tasks involving the Double Map (Tasks 7–10)