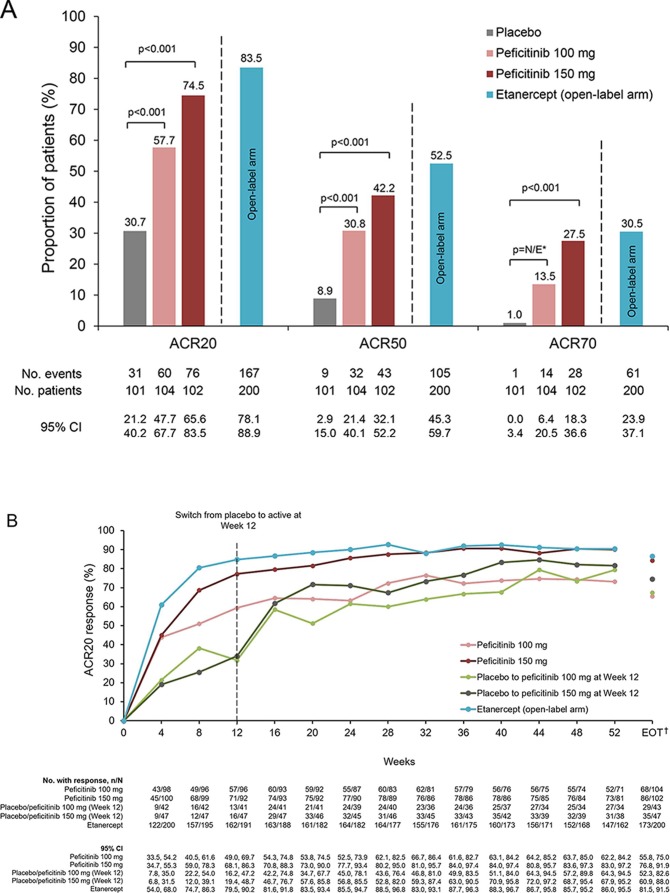
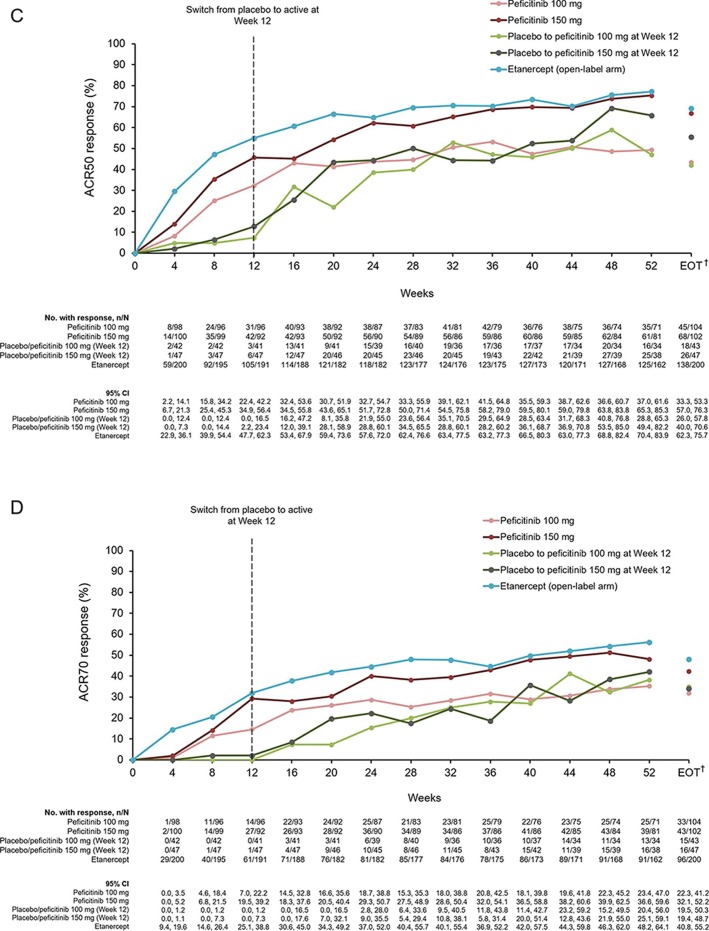
Figure 2.
(A) ACR20, ACR50 and ACR70 response rates at week 12/ET (FAS). (B) Response rates for ACR20 from baseline until week 52 and EOT (FAS). (C) Response rates for ACR50 from baseline until week 52 and EOT (FAS). (D) Response rates for ACR70 from baseline until week 52 and EOT (FAS). For all timepoints except for week 12/ET and EOT, observed data are plotted. For week 12/ET and EOT, in the case of early termination, ACR components were analysed using the LOCF method first, and then ACR20/50/70 responses were calculated. A pairwise comparison with the placebo group was performed using a logistic regression model with treatment group as the factor and inadequate response to prior biological DMARD use, concomitant DMARD use during the study period and region as covariates. P values were calculated using Wald’s Chi-square test with a closed testing procedure for multiplicity adjustment for ACR20 and no multiplicity adjustment for ACR50/70. 95% CI were based on a normal approximation to the binomial distribution (continuity corrected). Etanercept was an open-label reference arm and was not included in statistical comparisons with placebo. *The odds ratio for the treatment difference in ACR70 between peficitinib 100 mg and placebo was not estimable with the planned logistic regression model (p=0.009 with an ad-hoc analysis using a logistic regression model with treatment group as the only explanatory variable). †Includes LOCF. ACR, American College of Rheumatology; DMARD, disease-modifying anti-rheumatic drugs; EOT, end of treatment; ET, early termination; FAS, full analysis set; LOCF, last observation carried forward; N/E, not estimable.


