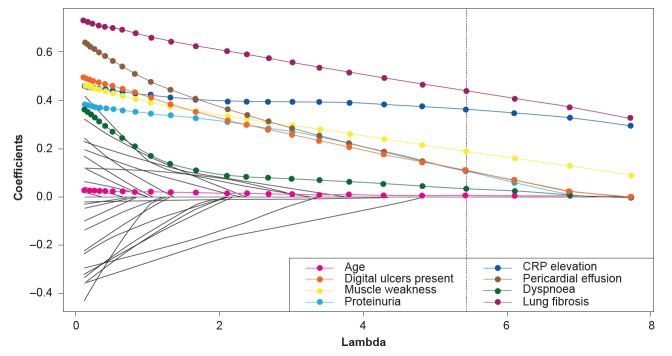
Figure 1.
Average regression coefficients across 100 imputations plotted against the penalisation parameter, lambda. The vertical dashed line represents the selected model chosen as it had the smallest Bayesian information criterion. Traces in colour are those of the regression coefficients (and hence predictor variables) that remained in the final model. Traces for excluded regression coefficients are plotted in black and are not specified in the legend. CRP, C-reactive protein.

