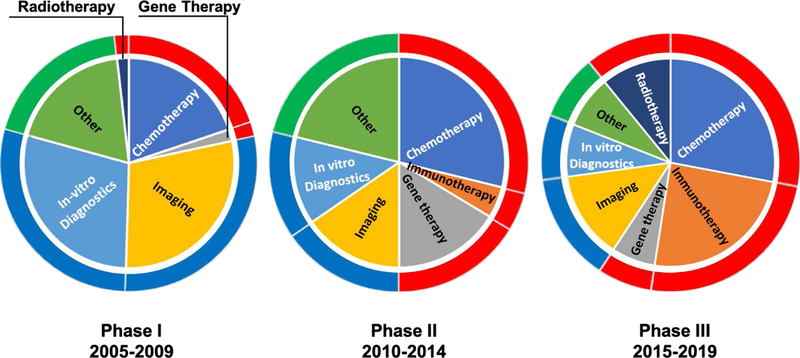
Figure 9.

Modalities of Alliance-funded projects over three different Phases of the program. These layered pie charts show the shift in modalities of Alliance-funded projects over the last 15 years. The inner pie chart displays the fraction of total Alliance projects that focused on in vitro diagnostics, imaging, gene therapy, radiotherapy, immunotherapy, chemotherapy, and other during each period. While, the outer ring is color-coded to emphasize the shift from a majority diagnostic (noted in blue) in Phase I to primarily therapeutic (noted in red) projects in Phase III. All other (materials characterization, for example) projects are noted in green.
