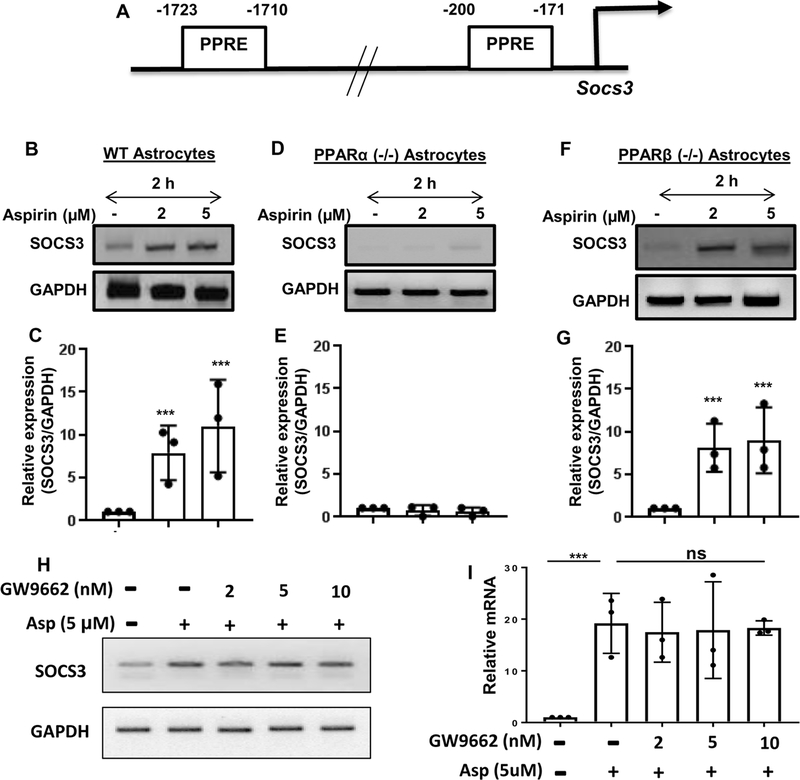
Figure 3. Involvement of PPARα in the expression of SOCS3.
(A) Map of the Socs3 gene promoter shows the presence of two PPREs at −1723 to −1710 bp (distal PPRE) and −200 to −171 bp (proximal PPRE). Astrocytes isolated from WT (B-C), PPARα (−/−) (D-E) and PPARβ (−/−) (F-G) mice were treated with different concentrations of aspirin for 2 h followed by monitoring the mRNA expression of Socs3 by semi-quantitative RT-PCR (B, D & F) and real-time PCR (C, E & G). Results are mean ± SD of three independent cell preparations. ***p < 0.001 vs control. WT astrocytes preincubated with different concentrations of GW9662 for 1 h were stimulated with aspirin (5 μM). After 2 h of stimulation, the protein level of SOCS3 was monitored by Western blot (H). Actin was run as a loading control. Bands were scanned and values (SOCS3/Actin) presented as relative to control (I). ***p < 0.001 vs control; ns, not significant. Significance of mean between control and aspirin-treated groups was analyzed by a two-tailed paired t-test.

