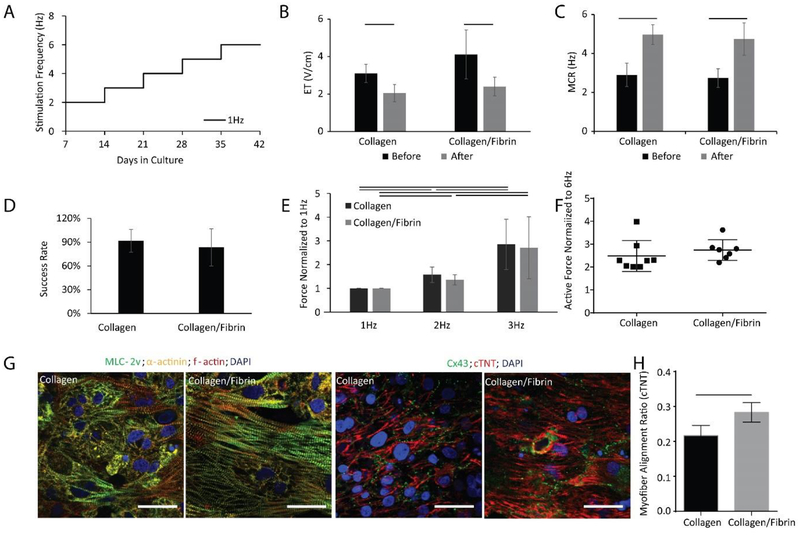
Figure 6: Biowire II platform can generate high fidelity tissues using different hydrogels.
BJ1D iPSC derived ventricular tissues were electrically stimulated as shown in panel A). Quantitative comparison of B) Excitation Threshold (ET), (n⩾8), C) Maximum Capture Rate (MCR), (n⩾8), D) Percent of tissues successfully reaching a positive Force-Frequency Relationship (FFR) by the end of cultivation (two batches of tissues), E) FFR, F) Post-Rest Potentiation (PRP) for tissues generated using Collagen vs. Collagen/Fibrin hydrogel (n⩾7). Data presented as mean ± stdev, Student’s t-test or two-way ANOVA with Tukey’s multiple comparisons test. G) Confocal images of tissues generated from Collagen vs. Collagen/Fibrin hydrogel stained with for α-actinin, myosin light chain-2v (MLC2v) and F-actin stain, and counterstained with the nuclear stain DAPI (left panels); and stained for connexin-43 (Cx43) and cardiac troponin T (cTNT), counterstained with DAPI (right panels). Scale bar=30 μm. H) Quantification of myofiber alignment using cTNT staining. (n=3). Data presented as mean ± stdev, Student’s t-test or Mann-Whitney test or ANOVA on ranks with Dunn’s multiple comparisons test.

