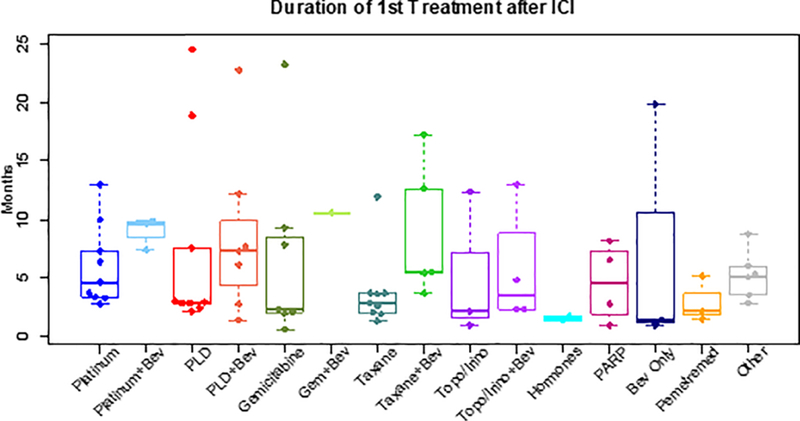
Figure 2: Duration of first treatment after ICI by regimen (In those with events only, n=75).

Box and whisker plots depicting durations of treatment in months for the first treatment line after ICI by treatment regimen. Durations of treatments after ICI were calculated as time-to-event variables using EFS. The 3 women remaining on first-line therapy after ICI treatment were censored for this analysis, and only the 75 women with events who completed first-line therapy were included.
