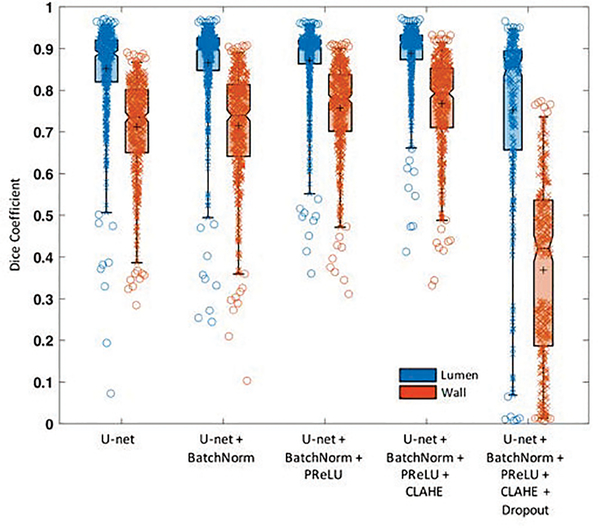
Fig. 3.
Segmentation performance evaluation on different methods. Boxplot shows the median with 25th and 75th percentiles. The “+” symbol points the mean and “o” shows the outliers. In this work, we adopted the U-net+BatchNorm+PReLU+CLAHE method that has Dice coefficient of 0.889±0.041 and 0.767±0.104 for lumen and vessel wall, respectively.

