Figure 3.

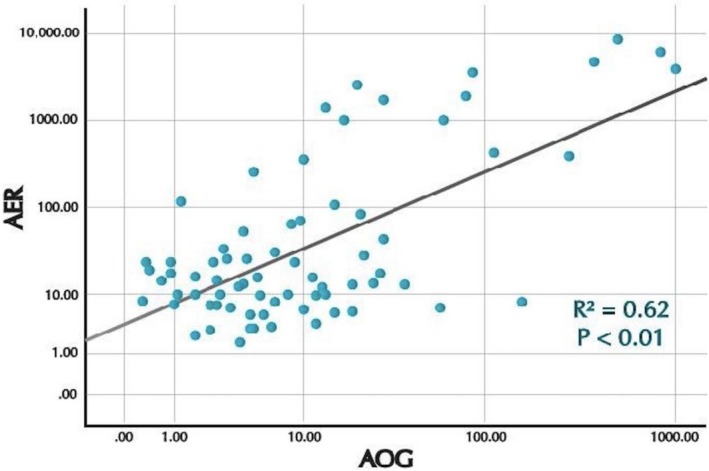
Scatterplots and correlation between log urine AOG and log AER (R 2 = 0.62, P < 0.01) during the DCCT and EDIC study visits combined. AER = Albumin excretion rate (mg/24 hr). AOG = Urine angiotensinogen, AOG/creatinine ratio (ng/mg).

Scatterplots and correlation between log urine AOG and log AER (R 2 = 0.62, P < 0.01) during the DCCT and EDIC study visits combined. AER = Albumin excretion rate (mg/24 hr). AOG = Urine angiotensinogen, AOG/creatinine ratio (ng/mg).