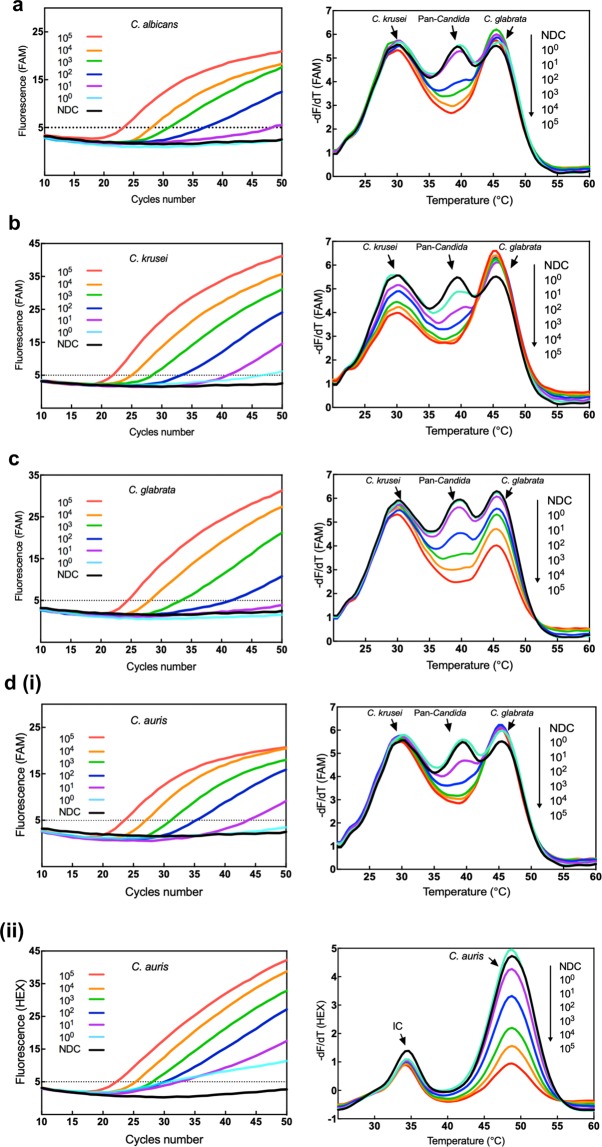
Figure 5.
Amplification profiles and melt curve analyses of genomic DNA in MPA-Candida assays. Amplification reactions containing a range of 1 to 105 GEs per reaction were set up. Post-amplification melt curve analysis was then carried out. Amplification plots of C. albicans (a), C. krusei (b) and C. glabrata (c) and their corresponding melt curve profiles are shown demonstrating changes in the pan-Candida peaks proportional to the number of GEs present in the reaction. Similar results can be seen for C. krusei and C. glabrata at their corresponding species-specific peaks in the FAM channel. (d) Amplification plots of C. auris and their corresponding melt curve profiles showing proportional changes to their pan-Candida (i) and C. auris-specific (ii) peaks in the FAM and HEX channels respectively. The horizontal dotted line is fixed as the threshold value of fluorescence.

