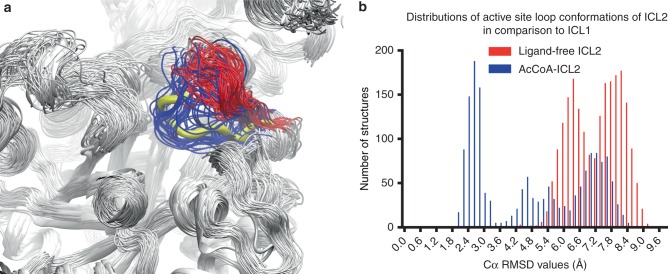
Fig. 3.
Active site loop conformations in ICL2. a Active site loop (residues 213–217) conformations sampled during MD simulation for ligand-free (red) and acetyl-CoA-bound (blue) ICL2. The active site loop in crystal structure of ICL1 in complex with isocitrate (PDB 3P0X) is superimposed and displayed as thick yellow ribbons. The rest of the enzyme structures are displayed in white for clarity. b Distributions of the RMSD values between the active site loop in ICL1 (residues 183–187, PDB 3P0X) and those in ligand-free and acetyl-CoA-bound ICL2 (residues 213–217)

