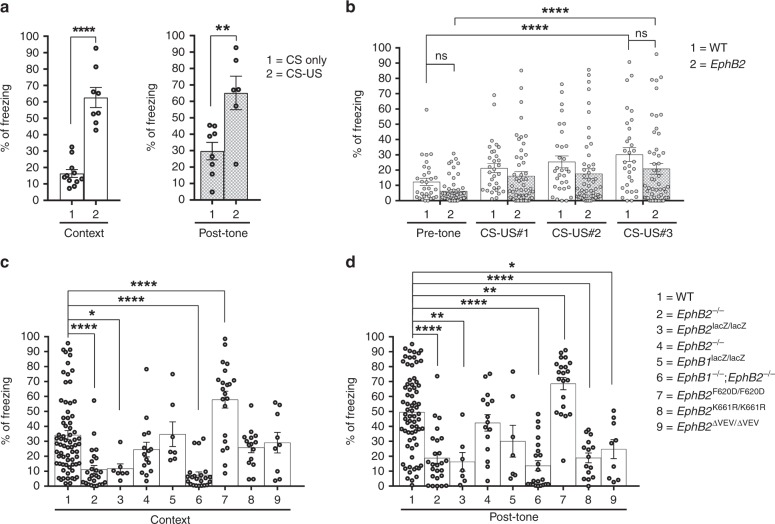
Fig. 1.
EphB-mutant mice exhibit reduced contextual and sound-cued FC memory. Following encoding/training (day 0), mice were subjected to the context test (day 2) and the sound-cued test (day 4). The percentage of time each mouse spent freezing is shown. a Freezing in a control group of WT mice that were either subjected to CS only training or CS-US training. For contextual test, CS only group 16.36% ± 2.42, n = 11; CS-US group 62.65% ± 6.1, n = 8; unpaired t-test, Welch-corrected t(9.21) = 7.04; for post-tone test, CS only group 29.79% ± 5.29, n = 8; CS-US group 65.14% ± 10.17, n = 6; unpaired t-test, t(12) = 3.32. b Learning during FC training was determined by comparing time freezing during the 120” prior to the first sound-shock (pre-tone) to the time freezing during the 30–60” periods immediatly following the first (CS-US#1, 60”), second (CS-US#2, 60”), and third (CS-US#3, 30”) sound-shock cycles. n = 31 WT, n = 53 a pooled collection of EphB2−/−, EphB2lacZ/lacZ, and EphB1−/−;EphB2−/− mutants; two-way repeated measures ANOVA, interaction F(3,246) = 0.29, p = 0.8326; effect of genotype F(1,82) = 4.27, p = 0.0419; effect of CS-US F(3,246) = 15.8, p < 0.0001; Sidak multiple comparison tests; effect of genotype pre-tone in WT vs. mutant t(328) = 1.32; effect of genotype CS-US#3 in WT vs. mutant t(328) = 2.06; effect of CS-US pre-tone vs. CS-US#3 in WT t(246) = 4.59; effect of CS-US pre-tone vs. CS-US#3 in mutant t(246) = 4.88. c, d Time freezing for each mouse in the context test (c) and sound-cued test (d). n = 70 WT, n = 25 EphB2−/− knockout, n = 7 EphB2lacZ/lacZ intracellular-truncated, n = 15 EphB1−/− knockout, n = 7 EphB1lacZ/lacZ intracellular-truncated, n = 22 EphB1−/−;EphB2−/− double knockout, n = 21 EphB2F620D/F620D kinase-overactive, n = 15 EphB2K661R/K661R kinase-dead, and n = 9 EphB2∆VEV/∆VEV PDZ domain binding-dead. For contextual test (c), one-way ANOVA, treatment F(8,182) = 11.76, p < 0.0001; Dunnett multiple comparison test to WT; EphB2−/− q(93) = 4.79; EphB2lacZ/lacZ q(75) = 2.73; EphB1−/− q(83) = 1.64; EphB1lacZ/lacZ q(75) = 0.078; EphB1−/−;EphB2−/− q(90) = 5.27; EphB2F620D/F620D q(89) = 4.61; EphB2K661R/K661R q(83) = 1.43; EphB2∆VEV/∆VEV q(77) = 0.69. For post-tone sound-cued test (d), one-way ANOVA, treatment F(8,182) = 16.43, p < 0.0001; Dunnett multiple comparison test to WT; EphB2−/− q(93) = 6.06; EphB2lacZ/lacZ q(75) = 3.86; EphB1−/− q(83) = 1.16; EphB1lacZ/lacZ q(75) = 2.26; in EphB1−/−;EphB2−/− q(90) = 6.76; EphB2F620D/F620D q(89) = 3.51; EphB2K661R/K661R q(83) = 4.95; EphB2∆VEV/∆VEV q(77) = 3.22. Error bars are standard error of the mean (SEM); ns non-significant; *p < 0.05, **p < 0.01, ***p < 0.001, ****p < 0.0001

