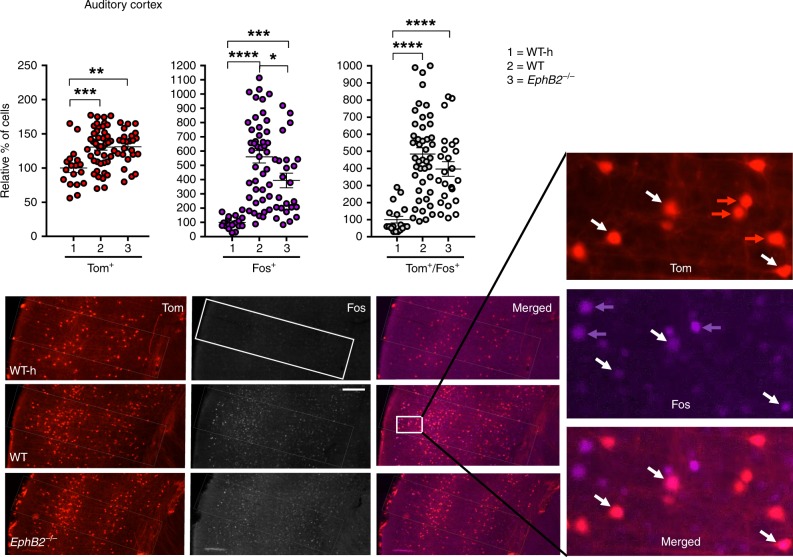
Fig. 4.
Analysis of Tom+ and Fos+ learning-associated neurons in the auditory cortex of EphB2 mutant mice. Neurons activated exclusively following encoding (Tom+ single-positive), exclusively following sound-cued retrieval (Fos+ single-positive), and following both encoding and retrieval (Tom+/Fos+ dual-positive) were imaged and counted in the auditory cortex from EphB2−/− mutants and WT littermates subjected to FC and WT home cage controls not subjected to FC (WT-h). Scatter plots show the number of Tom+ single-positive neurons, Fos+ single-positive neurons, and Tom+/Fos+ dual-positive neurons. Representative confocal images of Tom+ and Fos+ labeled neurons in the auditory cortex are shown with the box indicating quantification area. A magnified image from the WT auditory cortex is shown indicating individual Tom+-labeled cells (red arrows), Fos+-labeled cells (purple arrows), and Tom+/Fos+-double-labeled cells (white arrows). n = 18 hemisphere WT-h, n = 44 hemisphere WT, and n = 24 hemisphere EphB2−/−. For Tom+-single positive neurons, one-way ANOVA, F(2,83) = 8.66, p = 0.0004; Tukey multiple comparison test; WT-h vs WT q(60) = 5.55, p = 0.0005; WT-h vs EphB2−/− q(40) = 5.05, p = 0.0017; WT vs EphB2−/− q(66) = 0.09, p = 0.9979. For Fos+-single positive neurons, one-way ANOVA, F(2,83) = 22.61, p < 0.0001; Tukey multiple comparison test; WT-h vs WT q(60) = 9.48, p < 0.0001; WT-h vs EphB2−/− q(40) = 5.44, p = 0.0007; WT vs EphB2−/− q(66) = 3.77, p = 0.0248. For Tom+/Fos+-double positive neurons, one-way ANOVA, F(2,83) = 21.14, p < 0.0001; Tukey multiple comparison test; WT-h vs WT q(60) = 9.17, p < 0.0001; WT-h vs EphB2−/− q(40) = 6.36, p < 0.0001; WT vs EphB2−/− q(66) = 2.30, p = 0.2413. Error bars are standard error of the mean (SEM); *p < 0.05, **p < 0.01, ***p < 0.001, ****p < 0.0001. Scale bar = 100 μm

