Fig. 6.
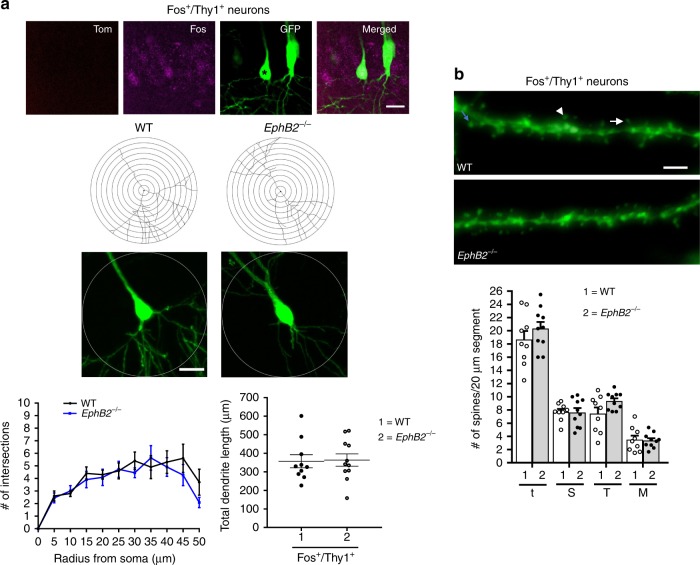
Analysis of dendritic branches and spine density/morphology in hippocampal CA1 of EphB2 mutant mice. Confocal z-stacked images of Thy1-GFPM labeled neurons that were activated exclusively following the sound-cued retrieval test (Fos+/Thy1+) were obtained from the CA1 region. a Representative images of a Fos+/Thy1+ neuron (asterisk), representative tracings of Thy1-GFPM labeled dendrites, and graphs of the quantified number of Sholl intersections and total dendritic length comparing WT and EphB2−/− mutant Fos+/Thy1+ neurons. n = 10 neurons from three WT brains, and n = 11 neurons from three EphB2−/− brains; two-way repeated measures ANOVA. Circle diameter = 100 μm and scale bar = 20 μm. b Representative images of Fos+/Thy1+ dendritic segments from WT and EphB2−/− mutant brains with arrows indicating mushroom shape (arrowhead) and thin (arrow) spines. Scatter plots of the quantified number of total spines (t) and breakdown into different morphologies of stubby (S), thin (T), and mushroom (M) shape spines. Spines from at least 3 × 20 μm dendrite segments per neuron were counted and averaged. n = 9 neurons from three WT brains, and n = 10 neurons from three EphB2−/− brains; two-way ANOVA. Scale bar = 2 μm

