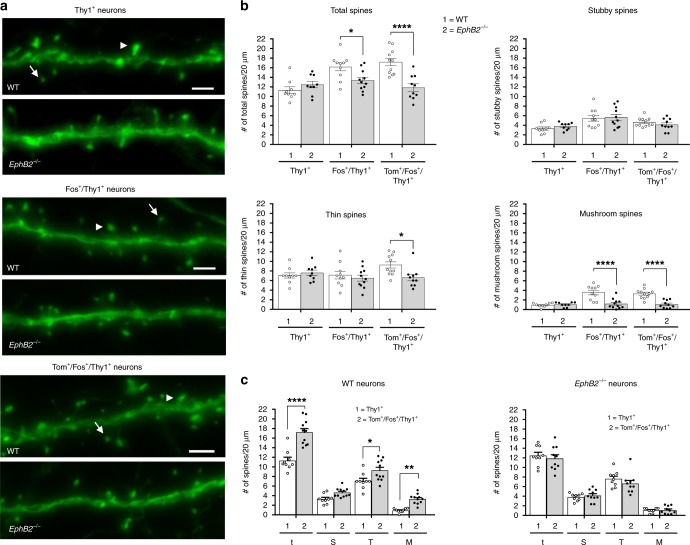
Fig. 8.
Analysis of spines in learning-associated neurons from the auditory cortex of EphB2 mutant mice. Spines were analyzed from Thy1-GFPM labeled neurons in layers 3–4 of the auditory cortex that were either Tom−/Fos− dual-negative (Thy1+), Fos+ single-positive (Fos+/Thy1+), or Tom+/Fos+ dual-positive (Tom+/Fos+/Thy1+). a Representative confocal z-stack images of dendritic segments from WT and EphB2−/− brains identify mushroom (arrowhead) and thin (arrow) spines. Scale bar = 2 μm. b Scatter plots of the quantified number of total spines and breakdown into different morphologies of stubby, thin, and mushroom shaped spines from the three different groups of Thy1+, Fos+/Thy1+, and Tom+/Fos+/Thy1+ neurons, comparing WT and EphB2−/− mutants. Spines from at least 3 × 20 μm dendrite segments per neuron were counted and averaged. n = 9 neurons from three WT brains and n = 9 neurons from three EphB2−/− brains (Thy1+ neurons), n = 10 neurons from three WT brains and n = 11 neurons from three EphB2−/− brains (Fos+/Thy1+ neurons), and n = 11 neurons from three WT brains, and n = 10 neurons from three EphB2−/− brains (Tom+/Fos+/Thy1+ neurons). For total spines, two-way ANOVA, interaction F(2,54) = 9.21, p = 0.0004; effect of genotype F(1,54) = 14.43, p = 0.0004; effect of neuron type F(2,54) = 8.52, p = 0.0006; Sidak multiple comparison test; Fos+/GFP+ neurons t(19) = 2.73; Tom+/Fos+/GFP+ neurons t(19) = 5.16. For thin spines, two-way ANOVA, interaction F(2,54) = 2.99, p = 0.0588; effect of genotype F(1,54) = 2.92, p = 0.0930; effect of neuron type F(2,54) = 1.54, p = 0.2225; Sidak multiple comparison test; Tom+/Fos+/GFP+ neurons t(19) = 2.93. For mushroom shaped spines, two-way ANOVA, interaction F(2,54) = 9.91, p = 0.0002; effect of genotype F(1,54) = 34.66, p < 0.0001; effect of neuron type F(2,54) = 11.57, p = <0.0001; Sidak multiple comparison test; Fos+/GFP+ neurons t(19) = 5.21; Tom+/Fos+/GFP+ neurons t(19) = 5.59. c Scatter plots of the quantified number of total (t), stubby (S), thin (T), and mushroom (M) shaped spines, comparing Thy1+ neurons and Tom+/Fos+/Thy1+ neurons from WT (left) or EphB2−/− mutant (right) brains. For WT brain, two-way ANOVA, interaction F(3,72) = 7.15, p = 0.0003; effect of neuron type F(1,72) = 60.95, p < 0.0001; effect of spine shape F(3,72) = 204.10, p < 0.0001; Bonferroni multiple comparison test; for total spines in WT t(18) = 7.8; thin shaped spines in WT t(18) = 2.91; mushroom shaped spines in WT t(18) = 3.16. Error bars are standard error of the mean (SEM); *p < 0.05, **p < 0.01, ****p < 0.0001

