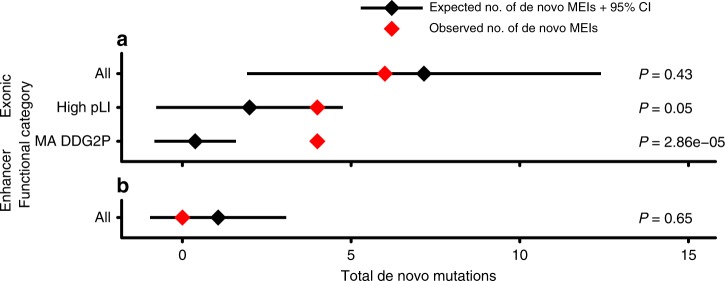
Fig. 4.
Estimating enrichment of deleterious MEIs. Depicted are the total number of expected (black) and observed (red) de novo mutations observed in exons (a) and enhancers (b) for all, high pLI (pLI > 0.9), and known monoallelic DD (MA DDG2P) genes. Expectation is based on the Poisson distribution of 100 simulations utilizing the neutral mutation rate (1.2 × 10⁻¹¹ μ). P-values are based on the Poisson distribution and used to determine statistical deviation of observed to expected de novo counts for exons and enhancers

